






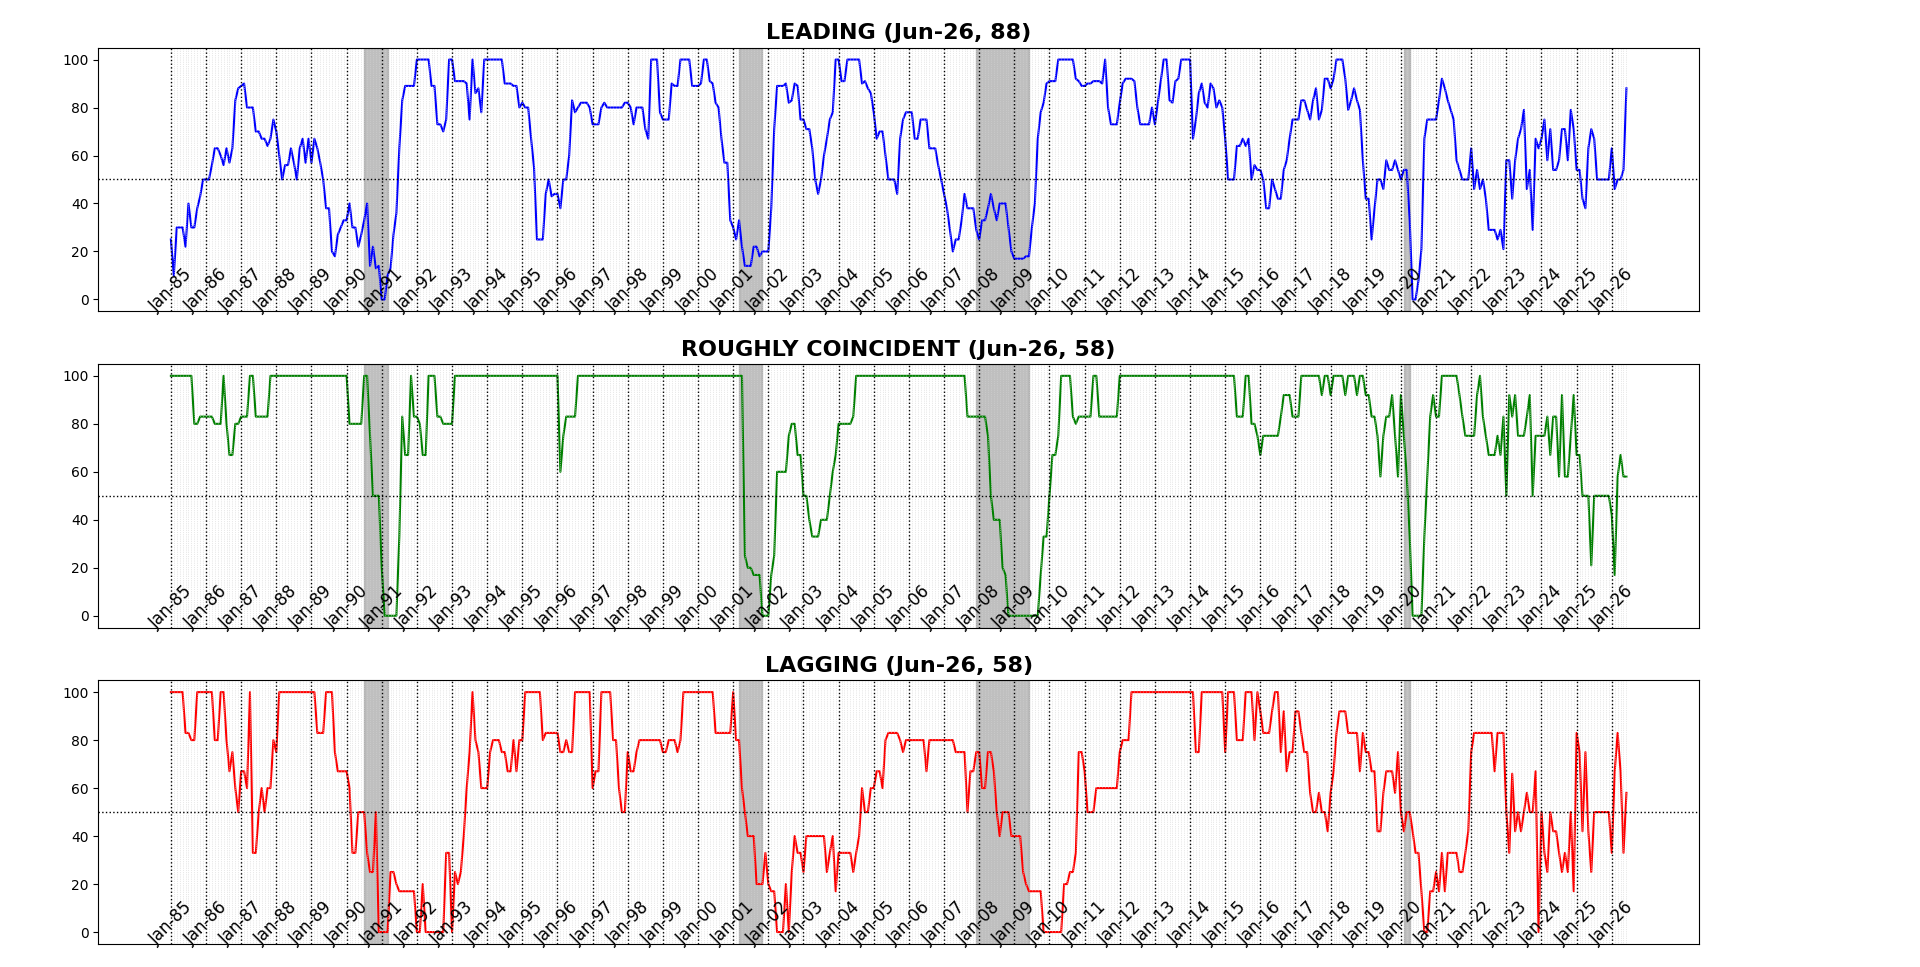
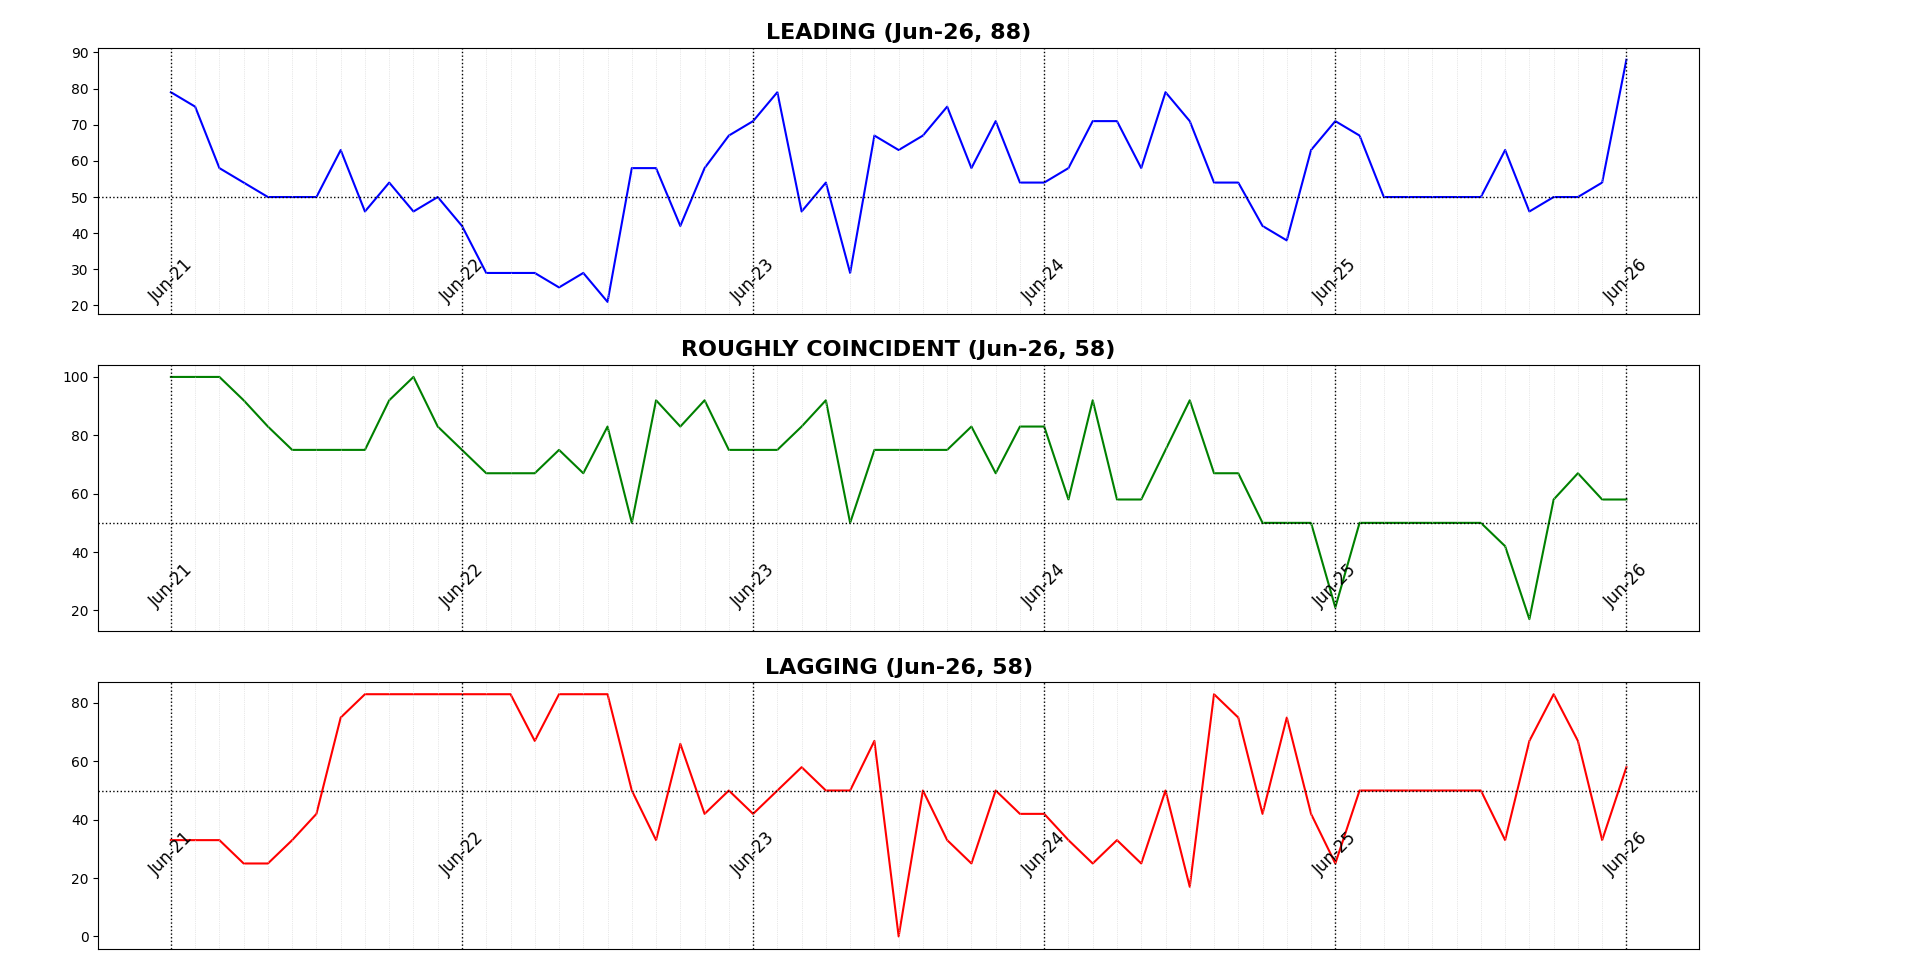
The June 2026 AIER Business Conditions Monthly (BCM) shows a pronounced improvement in forward-looking conditions, while measures of current and trailing activity remained considerably more subdued. The Leading Indicator surged to 88 from 54 in May, with gains extending across consumer expectations, financial markets, housing, retail activity, transportation, and capital-goods orders. The Roughly Coincident Indicator held at 58, suggesting that current economic activity continued to expand, but without the breadth evident in the leading data. The Lagging Indicator recovered to 58 from 33, reversing much of May’s deterioration as several credit, labor-market, inventory, and construction measures improved.
AIER Business Conditions Monthly Indicators — All Time
AIER Business Conditions Monthly Indicators — Five Years
LEADING INDICATOR (88)
The Leading Indicator rose sharply to 88, with ten of 12 components improving, one essentially unchanged, and only one declining.
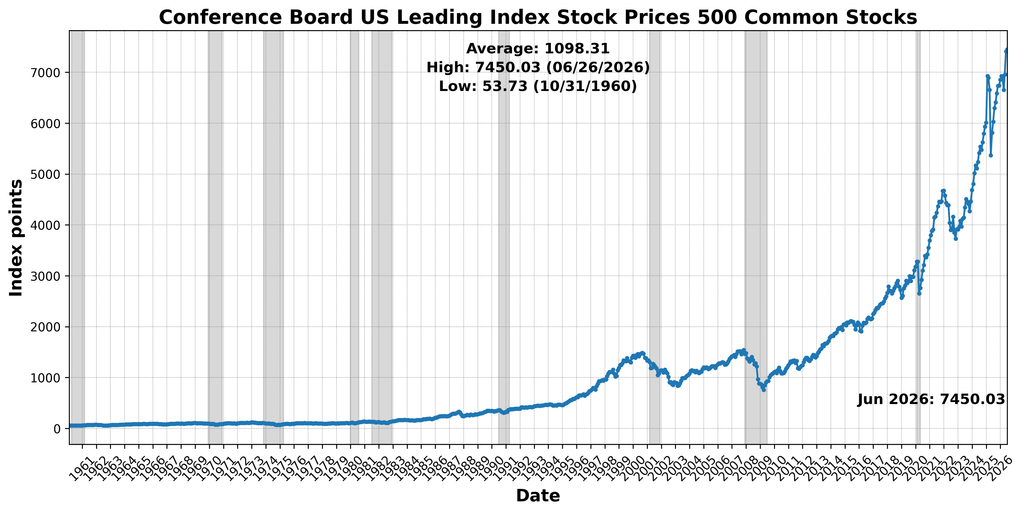
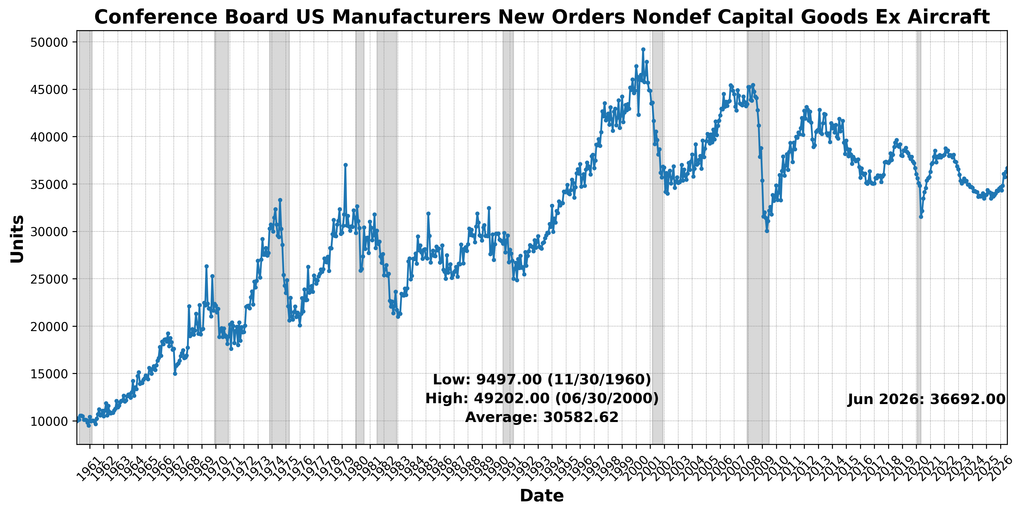
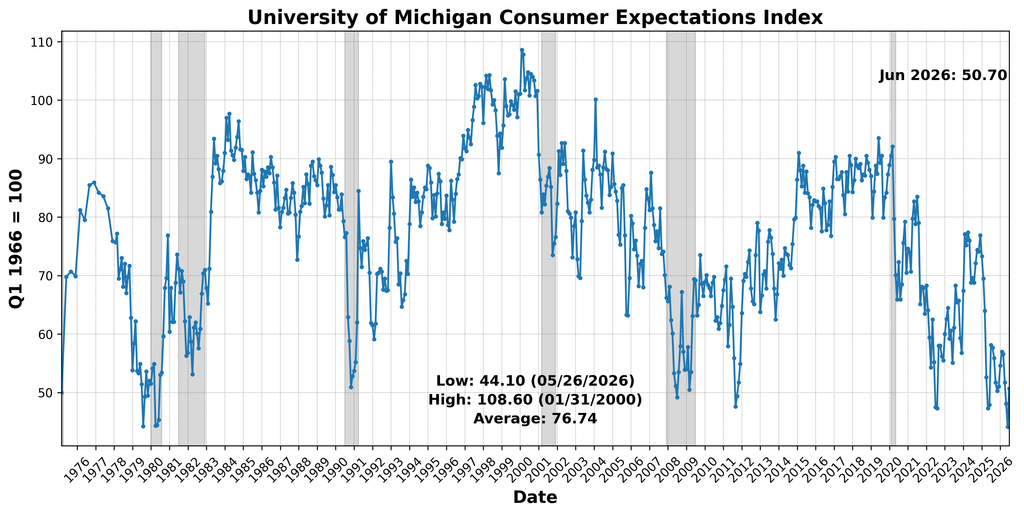
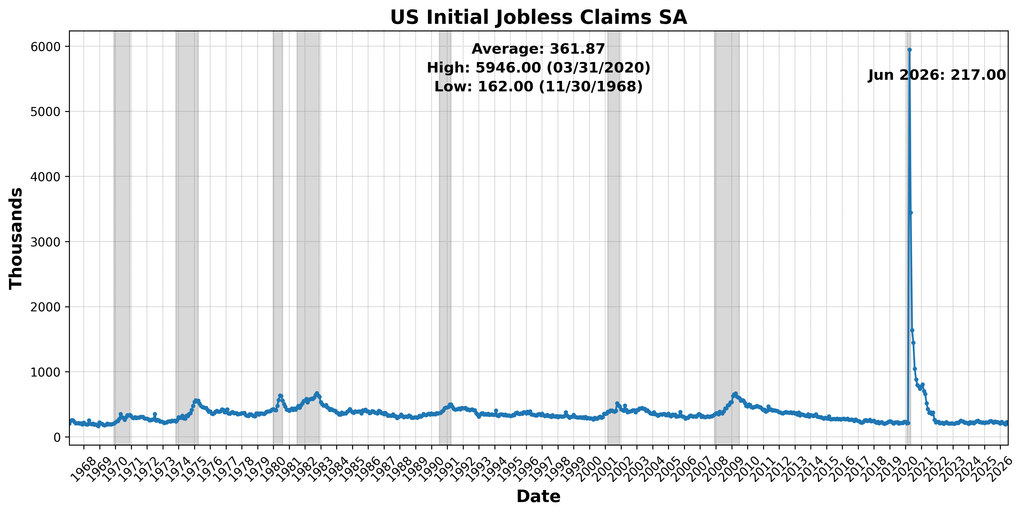
The improvement was unusually broad. The University of Michigan Consumer Expectations Index rose 15.0 percent, reversing some of the weakness in household expectations seen previously. Initial jobless claims declined 3.6 percent and, because lower claims represent an improvement in labor-market conditions, contributed positively after inversion. The Conference Board US Leading Index Stock Prices 500 Common Stocks increased 0.5 percent, while Conference Board US Manufacturers New Orders Nondefense Capital Goods Ex Aircraft rose 1.1 percent.
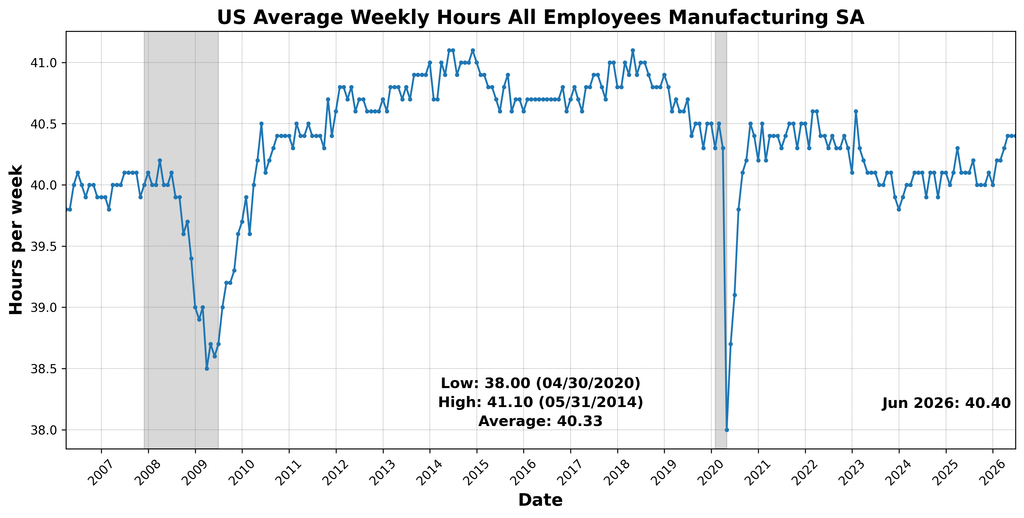
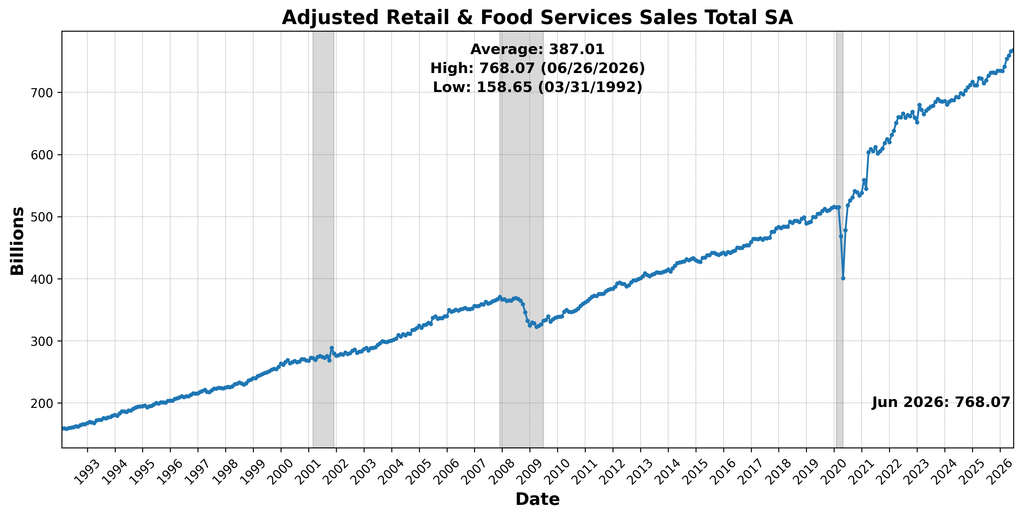
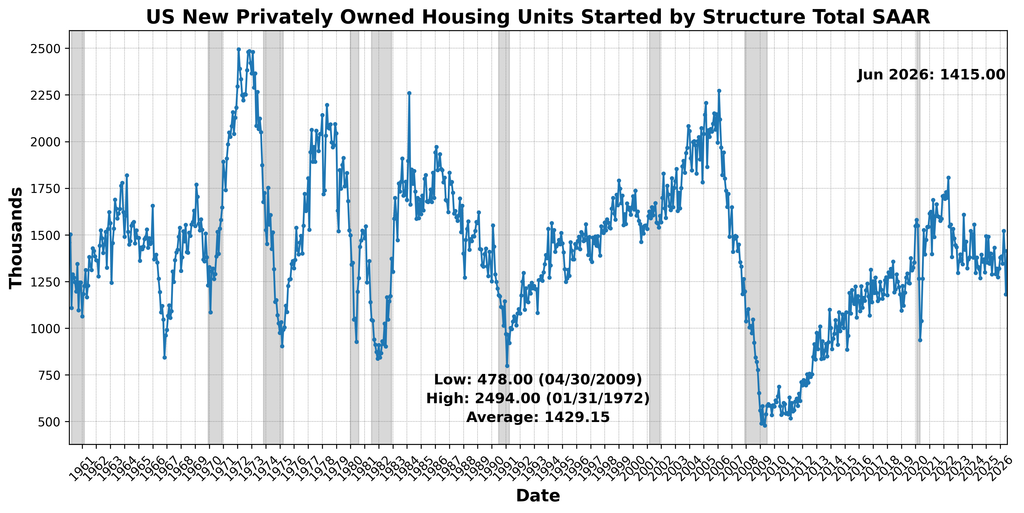
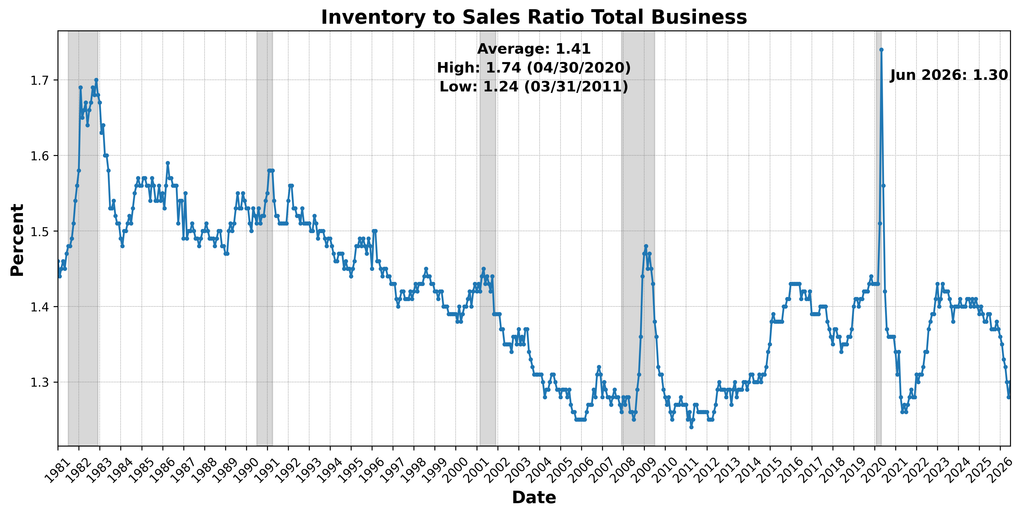
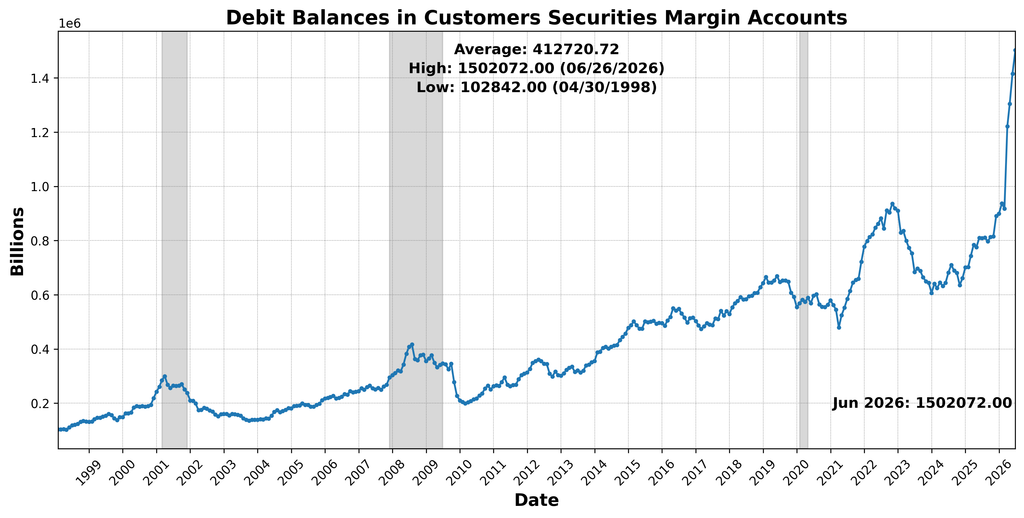
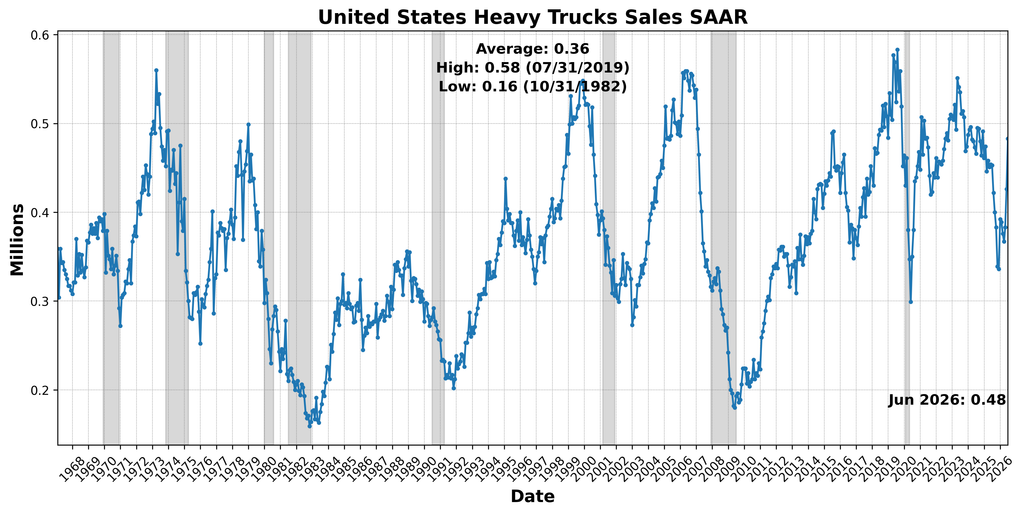
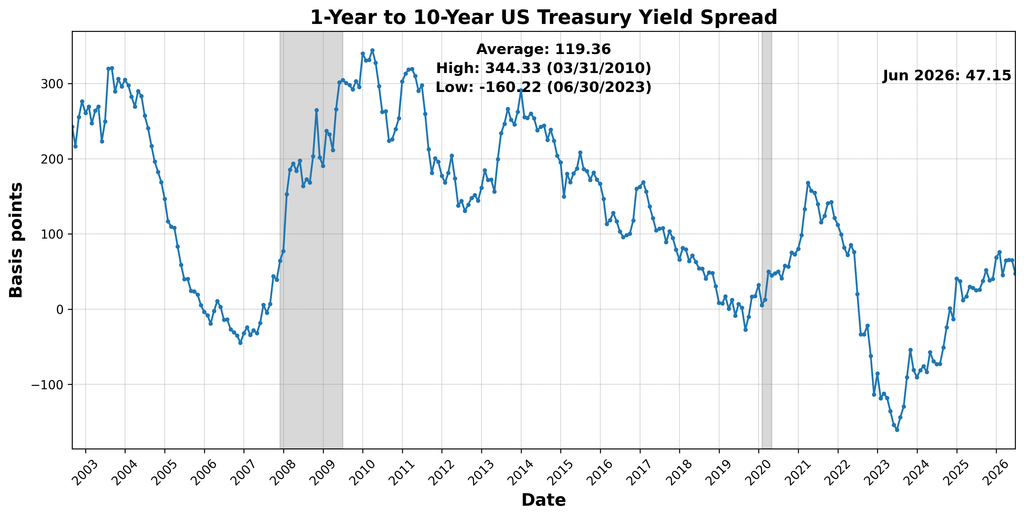
Housing and other demand-sensitive measures were also supportive. US New Privately Owned Housing Units Started by Structure Total SAAR jumped 19.7 percent, the Inventory-to-Sales Ratio Total Business increased 1.6 percent, and Adjusted Retail and Food Services Sales Total SA advanced 0.3 percent. United States Heavy Trucks Sales SAAR rose 13.4 percent, while Debit Balances in Customers’ Securities Margin Accounts increased another 6.1 percent. The 1-Year to 10-Year US Treasury Yield Spread narrowed substantially, falling 27.8 percent, but was scored positively under the BCM’s inverted treatment of that measure. US Average Weekly Hours All Employees Manufacturing SA was unchanged at 40.4 hours and therefore contributed neutrally.
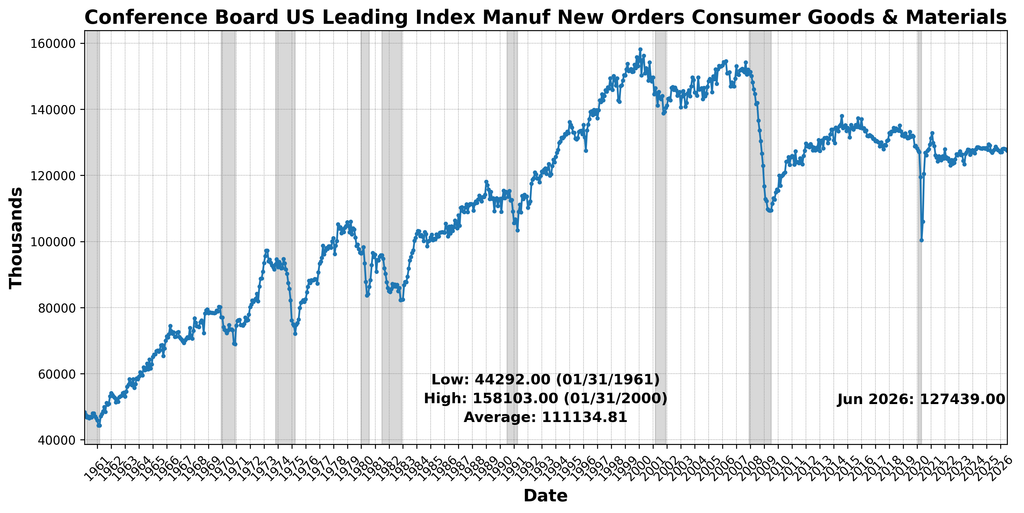
The principal exception to the broad improvement was Conference Board US Leading Index Manufacturers’ New Orders Consumer Goods and Materials, which declined 0.3 percent.
Taken together, June’s leading data represent a marked strengthening from May. The rise from 54 to 88 was not driven by one or two unusually strong components, but by improvement across a wide range of forward-looking measures. Consumer expectations, jobless claims, equities, capital-goods orders, housing starts, inventories, retail sales, heavy truck sales, margin debt, and the yield-spread signal all contributed positively. Although one month of stronger leading data does not establish a durable acceleration, the June reading points to substantially greater forward-looking breadth than was evident during the spring.
ROUGHLY COINCIDENT INDICATOR (58)
The Roughly Coincident Indicator remained at 58, with three of six components improving, one essentially unchanged, and two declining.
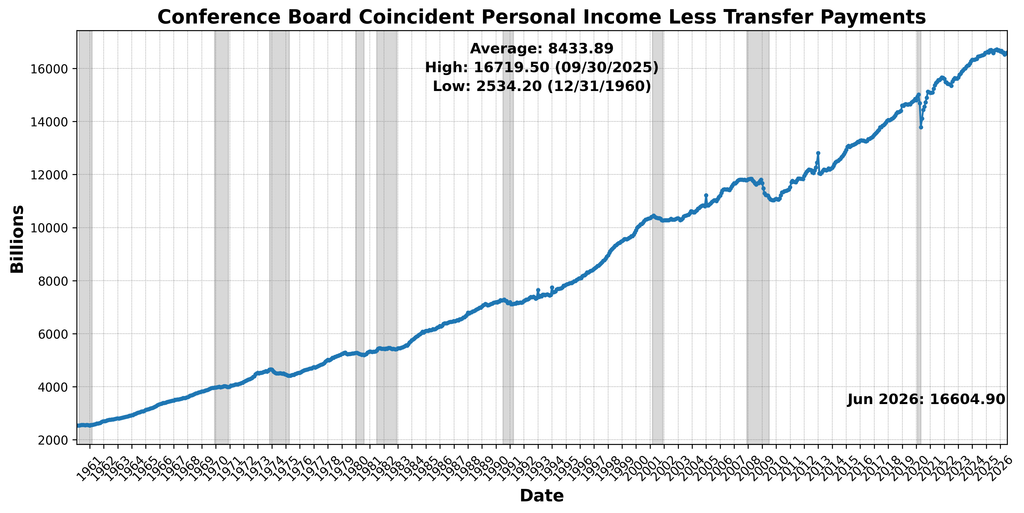
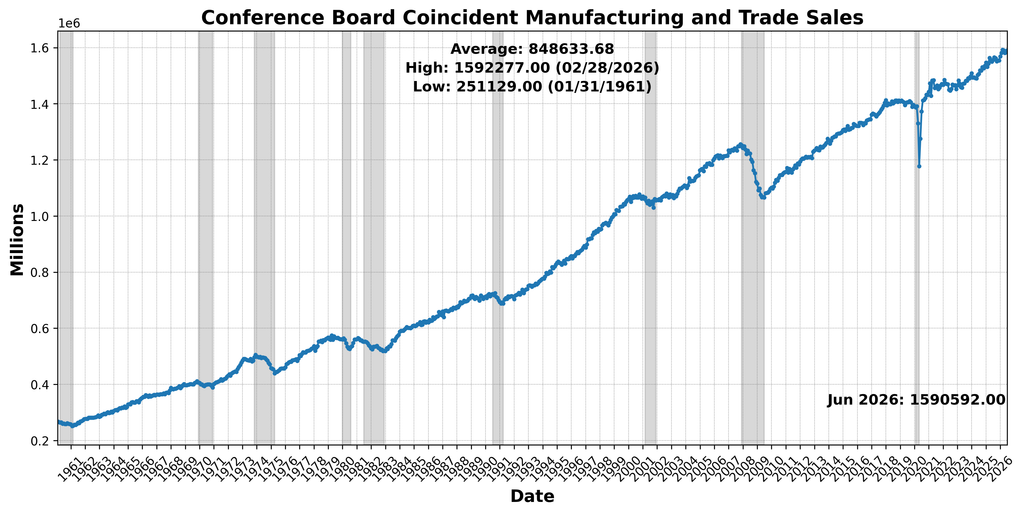
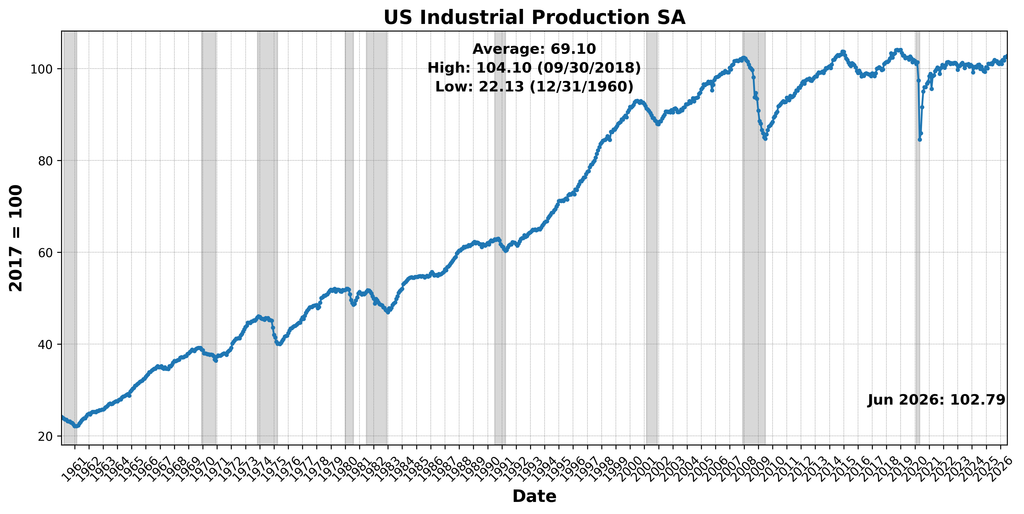
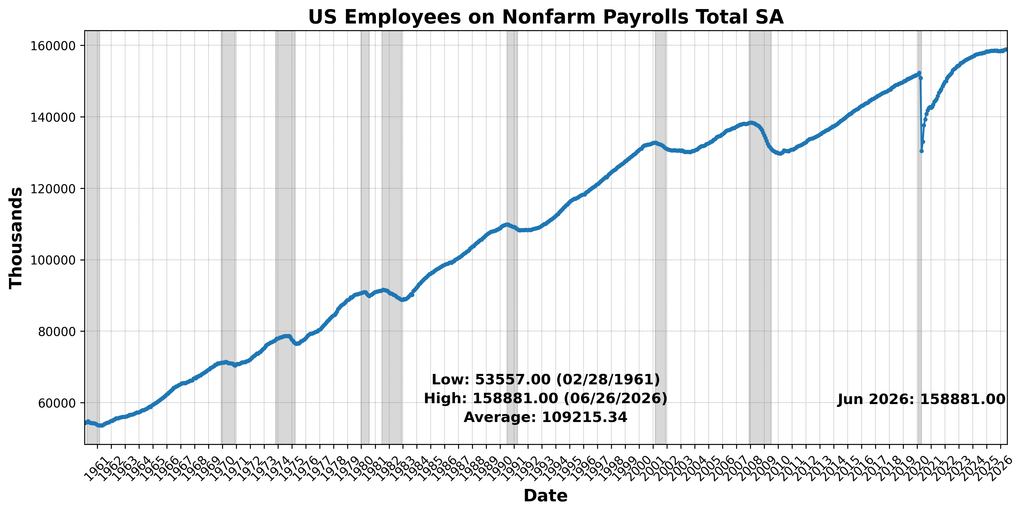
Measures of income, sales, and production continued to advance. Conference Board Coincident Manufacturing and Trade Sales increased 0.3 percent, reversing May’s decline, while Conference Board Coincident Personal Income Less Transfer Payments rose 0.2 percent. US Industrial Production SA increased 0.3 percent. US Employees on Nonfarm Payrolls Total SA was essentially unchanged, rising just 0.01 percent, and therefore contributed neutrally under the BCM scoring methodology.
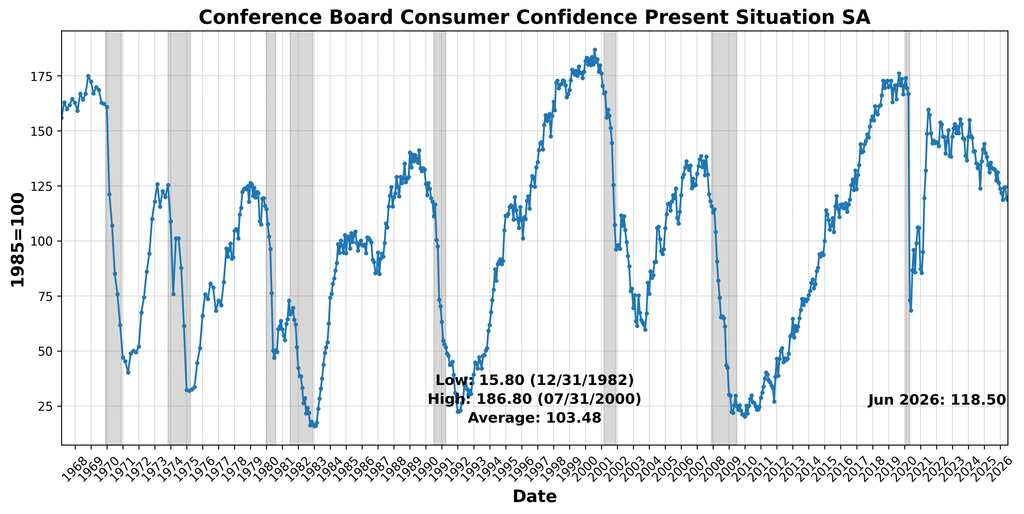
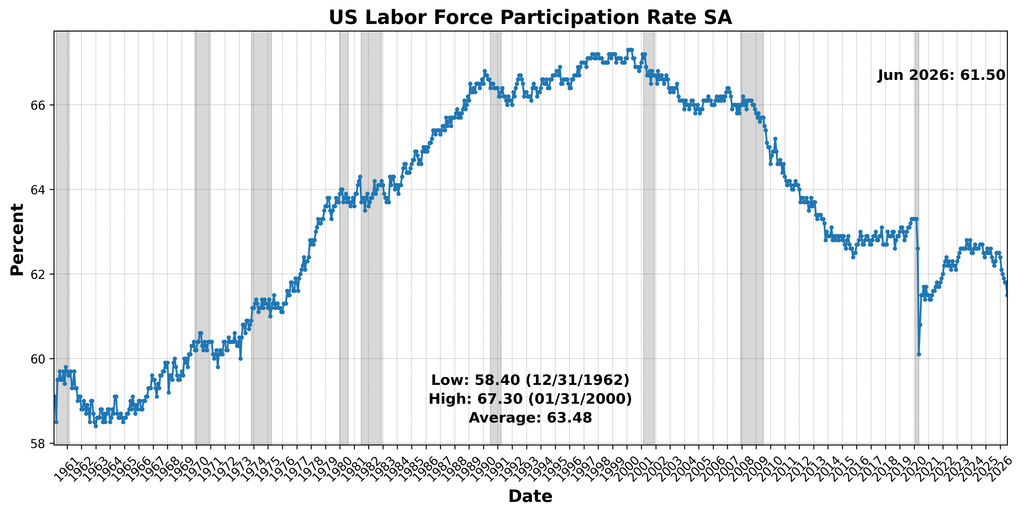
The weaker components were concentrated in confidence and labor-force participation. Conference Board Consumer Confidence Present Situation SA declined 0.8 percent, indicating some further softening in households’ assessment of current conditions. The US Labor Force Participation Rate SA fell from 61.8 percent to 61.5 percent, a 0.5 percent decline.
Overall, the coincident measures continue to describe an economy expanding at a modest and uneven pace. The unchanged reading of 58 masks some rotation among the underlying components: manufacturing and trade sales improved after weakening in May, while labor-force participation deteriorated and present-situation confidence remained soft. Income and industrial production continued to provide support, but the current-conditions picture remains substantially less vigorous than June’s leading indicators suggest.
LAGGING INDICATOR (58)
The Lagging Indicator rebounded to 58 from 33, with three of six components improving, one essentially unchanged, and two declining.
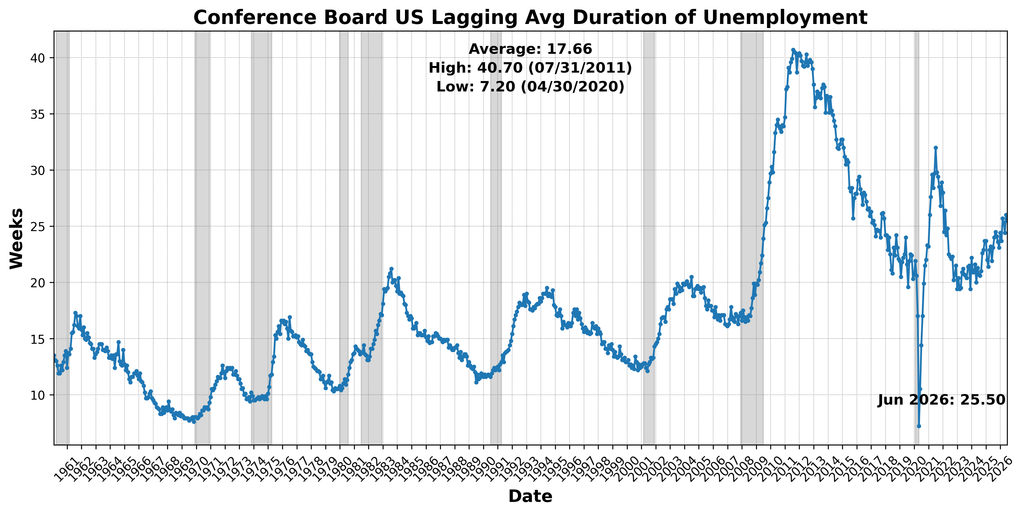
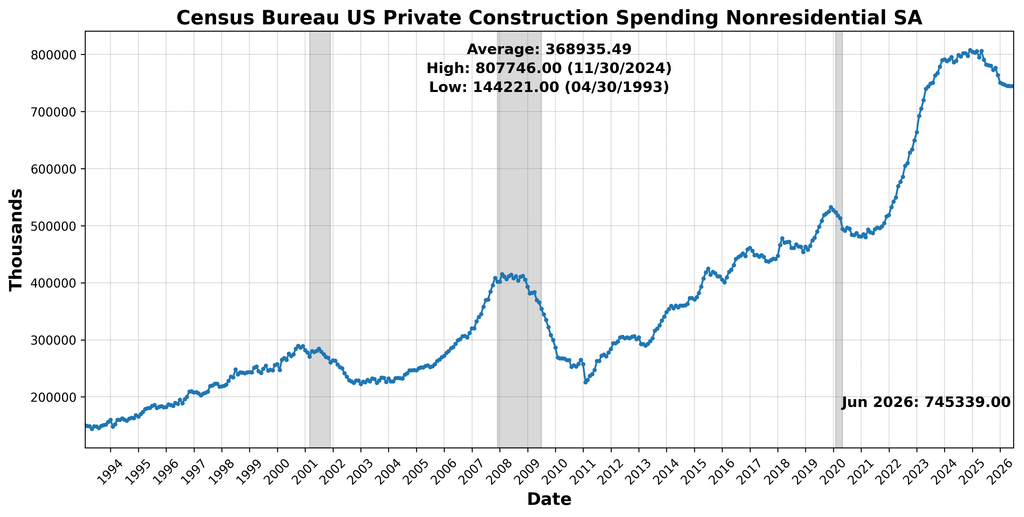
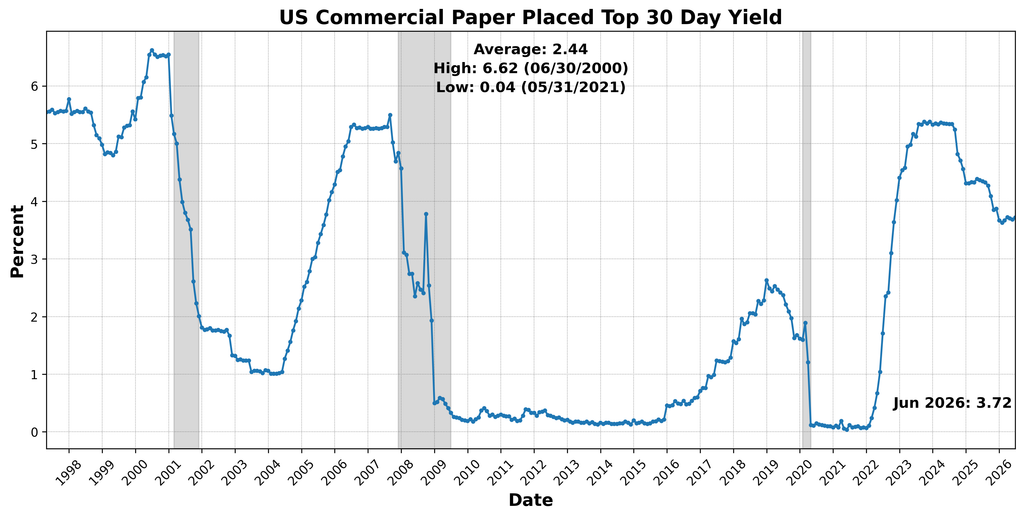
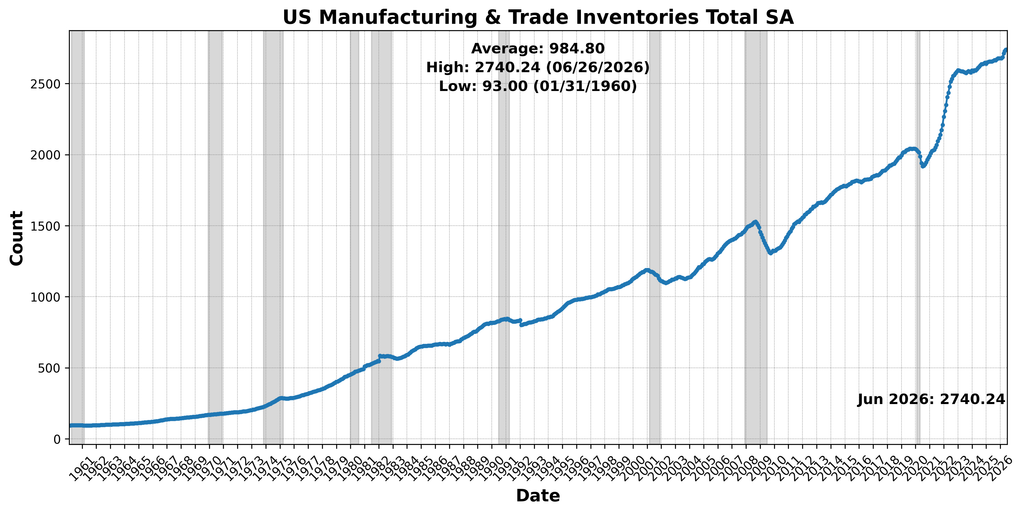
Several measures that weakened in May turned more favorable in June. US Commercial Paper Placed Top 30 Day Yield increased 0.8 percent. Conference Board US Lagging Average Duration of Unemployment declined 1.9 percent and, after inversion, contributed positively. Census Bureau US Private Construction Spending Nonresidential SA edged 0.1 percent higher. US Manufacturing and Trade Inventories Total SA increased only 0.04 percent, leaving the measure effectively unchanged and contributing neutrally.
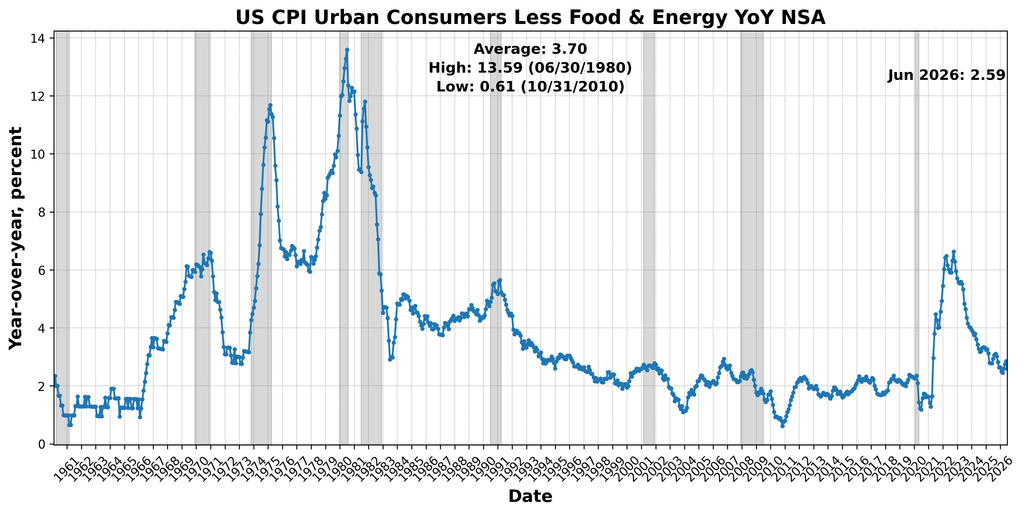
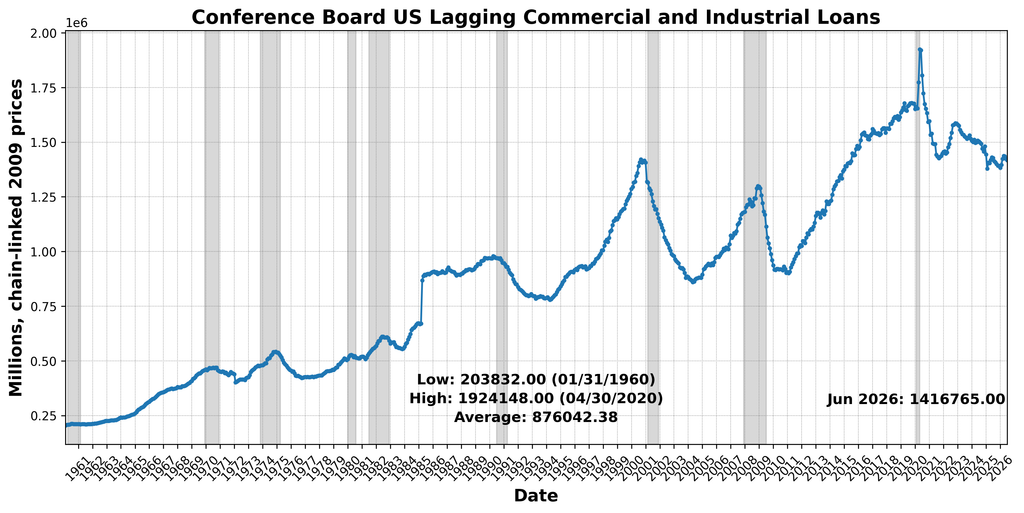
Two components restrained the index. US CPI Urban Consumers Less Food and Energy Year over Year NSA declined from 2.85 percent to 2.59 percent, a 9.1 percent decrease under the BCM’s month-to-month scoring calculation. Conference Board US Lagging Commercial and Industrial Loans declined 0.5 percent, extending weakness in that measure.
The recovery in the Lagging Indicator from 33 to 58 indicates that May’s sharp deterioration in trailing conditions did not continue into June. Short-term commercial paper yields, unemployment duration, and nonresidential construction shifted into the positive column, while inventories were essentially unchanged. At the same time, declining commercial and industrial lending remained a source of weakness, and the core inflation measure also scored negatively. The result is a considerably more balanced lagging picture than in May, though not one signaling uniformly strong conditions.
June’s BCM results therefore present a notably different configuration from May. Forward-looking conditions strengthened dramatically, with the Leading Indicator climbing from 54 to 88 and positive signals appearing across nearly every major category. Current conditions were steadier: the Roughly Coincident Indicator remained at 58 as gains in income, sales, and production were offset by weaker confidence and labor-force participation. Lagging conditions improved substantially, with the index recovering from 33 to 58. Taken together, the June readings suggest an economy whose forward-looking breadth improved considerably even as current activity remained moderate — an encouraging shift, but one that will require confirmation in subsequent months before it can be characterized as a sustained acceleration.
DISCUSSION (July/August 2026)
The July CPI rose just 0.07 percent, lowering the year-over-year rate to 3.4 percent, while core CPI increased 0.22 percent and slowed to 2.48 percent from a year earlier, matching its five-year low. Lower gasoline prices again provided substantial relief, food inflation moderated, and earlier supply pressures in food and metals showed signs of reversing, while the fading World Cup-related tourism boost contributed to declines in lodging, vehicle rentals, and recreational services. Services inflation rebounded modestly from June’s unusually soft reading, however, and the share of core CPI components rising at annualized rates above two percent increased to 53 percent from a second-quarter average of 42 percent. Producer prices were more reassuring: headline PPI was unchanged in July and core PPI rose only 0.2 percent, both below expectations, as falling energy and transportation costs offset firmer services prices. June’s PCE report similarly showed improvement, with headline prices falling 0.11 percent and core inflation slowing to 0.13 percent, even as real consumer spending remained solid at 0.4 percent. That spending increasingly appears to be outrunning household resources, however, as income rose only 0.2 percent and the saving rate slipped to 2.7 percent. Taken together, inflation continues to cool without a collapse in demand, but persistent services pressures and broader July price increases argue against declaring victory. With employment also weakening, the data provide little justification for renewed tightening while allowing the Federal Reserve to remain comfortably on hold.
July 2026 also marked a significant deterioration in US hiring, with payrolls declining 23,000 and revisions to May and June removing another 103,000 jobs from previously reported totals. The three-month average has consequently collapsed from more than 100,000 during the spring to only 20,000, while private employers added just 30,000 positions. Weakness was concentrated in local-government education, leisure and hospitality, retail, and financial services, with the post-World Cup reversal likely explaining some of the losses in restaurants and entertainment. Healthcare, normally an important source of employment growth, also slowed sharply, while construction added 22,000 jobs. The drop in unemployment from 4.2 to 4.1 percent provides little reassurance: household employment fell by 87,000, but a 264,000 contraction in the labor force mechanically reduced the number counted as unemployed and pushed participation down to 61.4 percent. June JOLTS data provide additional evidence of diminished labor demand, with openings falling to 7.36 million and workers continuing to quit at historically subdued rates, although layoffs remain low. ADP similarly reported just 44,000 new private-sector jobs in July, its weakest result this year, even as pay growth for job-switchers accelerated to seven percent. With average hourly earnings in the government report rising only 0.1 percent and aggregate labor-income growth slowing markedly, employment conditions are becoming a greater constraint on household spending while posing progressively less inflationary risk. The emerging pattern is therefore one of fewer opportunities and reduced labor-market mobility rather than widespread firing, adding another reason for the Fed to leave rates unchanged in September.
July’s ISM surveys showed a notable strengthening in demand and output, particularly in manufacturing, even as supply constraints, weak hiring, and elevated costs complicated the picture. The manufacturing PMI climbed from 53.3 to 55.6, its strongest reading of the current expansion, as factories increased production sharply in response to faster orders, growing backlogs, and renewed export demand. Employment returned to expansion for the first time since February, while inventories grew more slowly as strong demand absorbed existing stocks. Some caution is warranted because lengthening supplier delivery times mechanically boosted the index and may increasingly constrain actual factory output if access to raw materials becomes more difficult. Input costs continued to rise, although price pressures were less widespread than in June. Services presented a different mix: the headline PMI barely moved, rising to 54.1, but business activity jumped to 59.1 and new orders reached 57.2, with exports and imports also returning to expansion. That resurgence in demand did not translate into additional hiring, as the services employment index fell sharply to 47.4 amid reports that firms are relying on AI, restrained staffing, and relocation to meet higher demand without adding workers. Services prices also accelerated, with the prices-paid index exceeding 70 for the fourth time in five months.
The July surveys therefore depict an economy in which demand remains considerably stronger than the weakening labor data alone would imply, with manufacturers expanding production and services activity accelerating, but supply bottlenecks and persistent service-sector cost pressures posing increasingly important constraints.
US households and small businesses sent increasingly divergent signals about the economic outlook in the latest surveys. Preliminary University of Michigan data showed consumer sentiment falling sharply in August to 51.0 from 55.2, with most of the deterioration concentrated in expectations rather than assessments of current conditions. Concerns about purchasing power appear increasingly important: only eight percent of respondents expect their incomes to rise faster than inflation over the coming year, while short-term inflation expectations edged up to 4.3 percent and longer-term expectations remained elevated at 3.3 percent. Small businesses, by contrast, became more optimistic in July, with the NFIB index rising to 99.8 as hiring and capital-spending plans strengthened considerably. A net 20 percent of firms planned to hire, the highest share since October 2022, and investment intentions reached their strongest level since late 2024. Actual hiring remained weak, however, with more than half of businesses seeking workers reporting difficulty finding qualified applicants, suggesting that labor-market softness may partly reflect matching problems rather than simply disappearing demand. Pricing indicators also improved as fewer firms reported raising or planning to raise prices, although actual sales remained weak. The contrast between increasingly cautious households and more expansion-minded small businesses leaves a mixed outlook for domestic demand, particularly as consumers become more concerned about real incomes while firms continue to signal an appetite for workers and investment.
Consumer spending lost some momentum in July following a strong second quarter, although the details suggest moderation rather than a broad pullback by households. Headline retail sales fell 0.6 percent, substantially below expectations, while the control group used in calculating GDP declined 0.4 percent, its weakest performance since January 2025. Some of the deterioration reflected temporary factors: online sales dropped 2.2 percent following the boost from Amazon’s June Prime Day, while declining gasoline and motor-vehicle sales accounted for a significant portion of the headline decrease. Spending elsewhere was considerably firmer, with seven of thirteen retail categories advancing and clothing, health and personal care, general merchandise, furniture, and building materials all recording gains. Restaurant and bar sales increased another 0.5 percent, potentially benefiting from the final weeks of the World Cup, while light-vehicle sales remained above both their second-quarter and 2025 averages despite easing slightly to a 16.33 million annualized rate. The combination suggests that consumers remain willing to spend on discretionary services and large purchases, but the unusually strong pace of consumption earlier in the year is beginning to normalize as temporary supports fade and labor-market conditions soften.
Industrial production data also reinforced the increasingly uneven character of US growth, with investment-related manufacturing strengthening even as consumer-facing output weakened. Industrial production and manufacturing output each rose 0.2 percent in July, while upward revisions to June left the recent trajectory of factory activity somewhat stronger than previously reported. The composition was notably divided: consumer-goods production fell 0.4 percent and consumer durables declined 1.4 percent, consistent with softer retail and employment data, while business-equipment production increased 0.8 percent alongside further gains in computers, electronics, machinery, and electrical equipment. Eleven of eighteen major manufacturing industries expanded during the month, suggesting that strength was not confined to a single category, although capacity utilization remained well below its historical average. Continued spending on technology, artificial intelligence infrastructure, and other capital equipment is therefore providing an important counterweight to weakening household-related production, but the concentration of strength in investment-oriented industries still falls short of a broad industrial acceleration.
Second-quarter GDP presented a considerably stronger picture of the US economy than the headline growth rate initially suggests. Real GDP expanded at a 1.5 percent annualized rate, down from 2.1 percent in the first quarter, but the slowdown largely reflected drags from inventories and net exports rather than deterioration in domestic demand. Real final sales to private domestic purchasers accelerated sharply to 3.9 percent, as consumer spending rebounded to 3.2 percent and durable-goods purchases rose 6.8 percent. Business investment also remained robust, with equipment spending increasing more than 15 percent and gains extending across industrial, transportation, and information-processing equipment rather than being confined to artificial intelligence. Software and R&D investment provided additional support, although spending on structures continued to decline. The principal concern was inflation: the GDP deflator accelerated to 6.2 percent, underscoring the persistence of price pressures despite slower headline output growth. Overall, the report depicts an economy with substantially greater underlying momentum than the 1.5 percent GDP figure implies, but with enough inflationary pressure to reinforce the case for the Federal Reserve to remain cautious rather than respond to the headline slowdown with easier policy.
Monetary and fiscal policy are increasingly intersecting as persistent inflation constrains the Federal Reserve while heavy federal borrowing puts pressure on longer-term interest rates. Minutes from the July FOMC meeting showed that most officials favored holding rates steady, although several supported a 25-basis-point increase and many remained concerned that prolonged above-target inflation could become embedded in expectations and price-setting behavior. At the same time, policymakers and Fed staff identified growing downside risks associated with AI financing, asset valuations, and weaker economic data, reinforcing the case for leaving rates unchanged in September.
Fiscal conditions present a different challenge. With the 2026 deficit now on track to approach $2.1 trillion amid higher interest costs, tariff refunds, and war-related spending, Treasury faces unusually heavy financing requirements and increasing sensitivity at the long end of the yield curve. Secretary Scott Bessent’s decision to at least double long-dated Treasury buybacks briefly reduced 10- and 30-year term premiums by roughly six and ten basis points, respectively, an unusually large response given the modest scale of the intervention, but much of the decline quickly reversed. The episode illustrates the limits of debt-management policy: altering the maturity composition of outstanding debt can temporarily reduce the duration absorbed by private investors, but cannot eliminate the underlying supply created by persistent deficits. With the Fed reluctant to ease while inflation remains elevated and Treasury increasingly focused on containing long-term borrowing costs, the interaction between monetary policy, debt management, and fiscal policy is becoming more consequential, particularly if continued upward pressure on yields eventually generates demands for greater coordination between the Fed and Treasury.
As this report goes to publication, several consequential but highly fluid developments in US trade policy are unfolding, with potentially significant implications for supply chains, inflation, and relations with major trading partners.
The administration’s promised “economic D-Day” against Iran has so far produced sanctions on more than 70 Iran-related entities and threats of secondary penalties against countries maintaining economic or financial ties with Tehran, but the more consequential question is whether enforcement will ultimately fall most heavily on China, which purchases roughly 80 percent of Iranian oil; 26 of the initial sanctions targets are based in mainland China or Hong Kong, and broader action against major Chinese banks, refiners, or energy companies could quickly jeopardize the fragile US-China trade truce.
Simultaneously, trade relations with Canada have deteriorated sharply following the collapse of bilateral negotiations, with 50 percent US tariffs taking effect on roughly $20 billion of Canadian exports and President Trump threatening to raise tariffs on Canadian automobiles and parts to 50 percent beginning January 1, 2027. Ottawa is preparing retaliatory tariffs and domestic assistance for affected workers and businesses, while both governments continue to leave open the possibility of renewed negotiations. Taken together, the two disputes introduce substantial uncertainty into the outlook: measures nominally directed at Iran could reopen a broader confrontation with China, while escalating US-Canada tariffs threaten deeply integrated North American automotive, steel, and manufacturing supply chains, potentially creating renewed upward pressure on costs even as recent domestic inflation data have been improving.
The economic signals entering late summer are unusually difficult to reduce to a single characterization. Second-quarter domestic demand was substantially stronger than the 1.5 percent headline GDP growth rate implies, and July data show continued strength in capital investment, manufacturing orders, business equipment, and services activity. Yet that strength is increasingly disconnected from conditions facing households. Payrolls contracted in July, previous employment estimates were revised sharply lower, labor-force participation declined, retail spending weakened, consumer confidence fell, and income growth has failed to keep pace with consumption. Businesses, meanwhile, continue to report ambitious hiring and investment plans despite difficulty translating those intentions into actual employment. Inflation provides some relief: core CPI has returned to a five-year low, producer prices were softer than expected, and recent PCE readings have moderated. But services costs and inflation expectations remain sufficiently elevated that renewed tightening cannot be dismissed entirely. For now, weaker employment alongside improving inflation makes unchanged rates the most defensible course for the Fed.
An increasingly important source of uncertainty lies outside the conventional business cycle. Federal borrowing requirements continue to expand, long-term Treasury yields remain sensitive to enormous prospective debt supply, and Treasury’s decision to enlarge long-duration buybacks produced an initially powerful but largely temporary reduction in term premiums. At the same time, Washington is escalating economic pressure abroad on two fronts. Sanctions intended to economically isolate Iran increasingly implicate Chinese refiners, financial institutions, and other entities, creating a potential collision with the tentative US-China trade détente, while the rapidly deteriorating dispute with Canada threatens tariffs and retaliation across automobiles, steel, agriculture, and other deeply integrated North American industries. Thus the central risk over the coming months may be less that private economic activity is spontaneously rolling over than that an already less-balanced expansion encounters additional shocks generated by fiscal stress, trade restrictions, geopolitical conflict, or some combination of the three.
LEADING INDICATORS





ROUGHLY COINCIDENT INDICATORS
LAGGING INDICATORS
CAPITAL MARKETS PERFORMANCE



![Connecting Learning Strategy To Business Impact [eBook Launch]](https://kumbhcoin.org/wp-content/uploads/2026/10/Connecting-Learning-Strategy-To-Business-Impact-eBook-Launch-450x268.jpg "Connecting Learning Strategy To Business Impact [eBook Launch]")

