


L&D Reporting: Common Mistakes And Best Practices
A completed training program gives L&D a different reporting job. During the rollout, the team tracks progress, completion, scores, learner feedback, and manager follow-ups. These details help manage the program while it’s running.
Once the program ends, the conversation changes. Stakeholders usually look for a different level of insight: whether the original business problem moved in the right direction and how strong the evidence is. That shift often leads to three common mistakes in L&D reporting.
Where L&D Reporting Usually Goes Wrong
Mistake #1: Reporting Activity As The Result
Activity metrics are easy to report because they come directly from your learning dashboards. The problem is that they describe training delivery, not business change.
Completion, attendance, and quiz scores are useful signals, but they are still one step away from the real question: did people do their jobs better after training?
Over time, this weakens L&D’s position. If reports only prove that training was delivered, stakeholders have fewer reasons to see L&D as a driver of performance.
Mistake #2: Showing Numbers Without A Clear Takeaway
Look at a simple metric: 80% completion. On its own, it doesn’t tell stakeholders much. For a voluntary leadership program, this may signal strong adoption. For mandatory compliance training, it may expose a serious coverage gap. If the missing 20% are frontline managers, the risk is different again because they may be the very people expected to reinforce the new behavior.
The reporting mistake is leaving that work to the reader. When stakeholders have to interpret the numbers themselves, they may miss the point, question the result, or focus on the wrong issue.
Mistake #3: Claiming More Impact Than The Data Can Support
It’s tempting to make the impact statement as strong as possible: “After the sales training, revenue increased by 18%.” The number looks impressive, but the claim can fall apart quickly if the report doesn’t show how training contributed to that change.
That’s the risk with unsupported impact claims. The stronger the statement sounds, the more evidence stakeholders expect to see. If the report cannot link the training to business results, the claim becomes easy to question.
Make Training Results Easier Τo Understand Αnd Act On
A strong executive report is much easier to build when reporting is planned before training starts. Otherwise, you’re left to work with whatever evidence is left. That may be enough for a basic update, but it’s rarely enough for a strong impact story.
Before the program starts, define the business problem, current performance, and the business metrics that should improve if training works. This is part of any effective enterprise learning strategy. Later, when stakeholders ask for results, you’ll have a real comparison point.
Tie The Report To The Original Business Goal
You can measure training effectiveness from many angles, but the L&D executive report should focus on what connects to the original business goal.
Take onboarding, for example. If the goal was faster achievement of productivity, look at ramp-up time, readiness milestones, manager support, and early performance. If the goal was consistency across locations, focus on whether new hires learned the same process and reached the same standard across teams.
That’s the filter for the entire report. The business expectation tells you what data to collect, how much detail to show, and where to focus the impact story.
Don’t Mix Rollout Together With Impact Data
Both belong in the report, but they shouldn’t merge into one success claim. Before you judge impact (performance, behavior, productivity, or risk), check whether the training had a fair chance to work.
In iSpring LMS, 25+ real-time reports help you check rollout from different angles: learner, team, department, or location.

iSpring content reports go one level deeper. They show which courses learners open most often, where they stop, and where they spend more time. This helps separate a weak rollout from a weak learning experience. If learners consistently drop off in one module or spend much longer than expected on it, the report can point to a specific improvement instead of a vague “engagement issue.”
In simple terms, rollout data helps validate the results of the entire program. That’s why it helps to have a reliable LMS where all evidence is centralized, so you can return to it without digging through scattered notes and spreadsheets.
Build A Chain Of Evidence, Not A Single Big Claim
To make an L&D report credible, collect workplace evidence. Stakeholders need to see that employees are using the new skill, following the new process, or applying the required standard in real situations.
That evidence can come from different places:
- Call reviews, CRM notes, and pipeline data for sales training
- QA scores, complaint trends, and support tickets for customer service training
- Audit findings, safety inspections, and process follow-through for compliance training
- Coaching notes, team feedback, and performance check-ins for leadership training
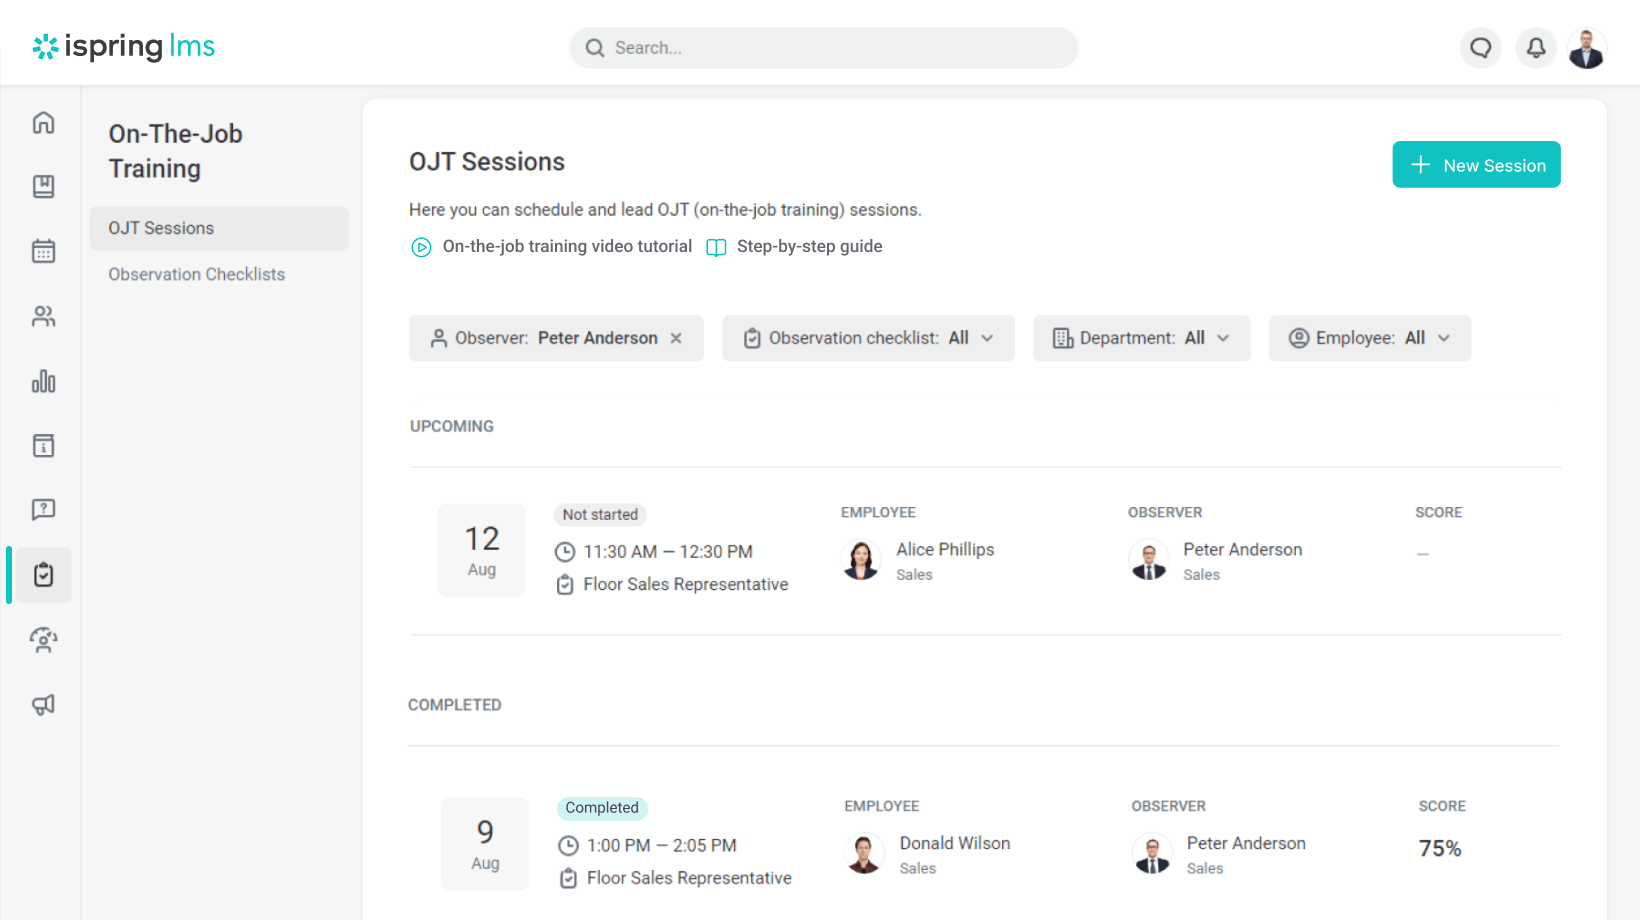

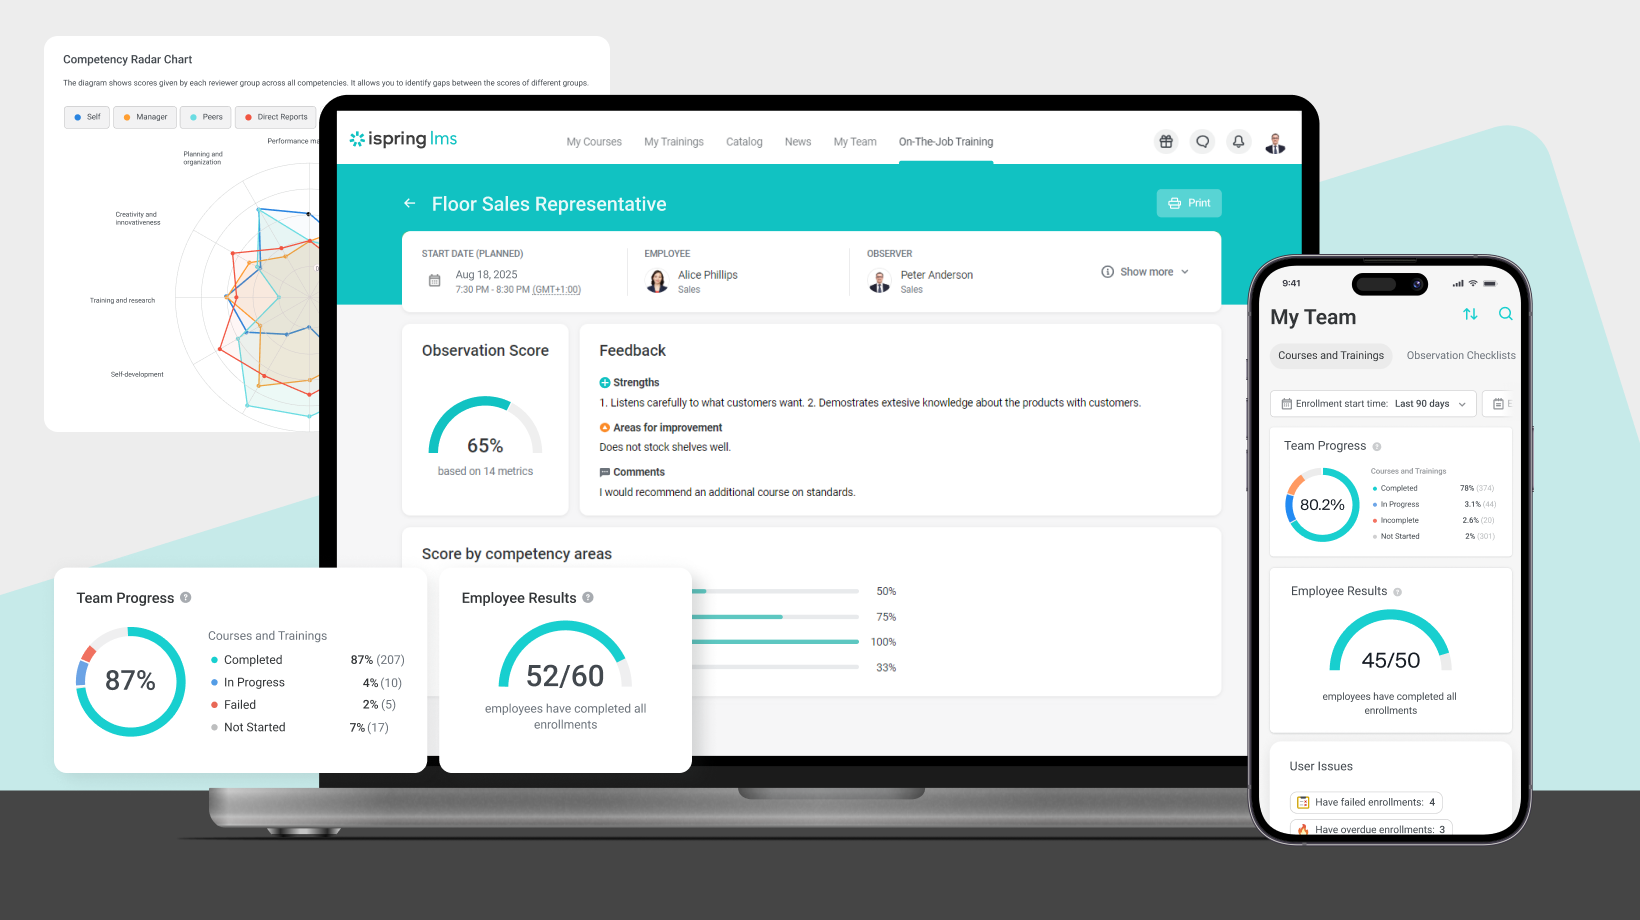
iSpring LMS helps L&D capture workplace evidence more consistently. With on-the-job training, team leaders can observe employees in actual work situations, check whether they apply the required skills, leave feedback, and save the results in the LMS.
Instead of relying on manager comments after the program ends, L&D can bring documented evidence of on-the-job performance into the report.
Be Honest About What The Data Can And Cannot Prove
If sales grew after training, that’s worth reporting. Still, experienced stakeholders will naturally ask what else may have influenced the result: lead quality, manager coaching, pricing, seasonality, market demand, or changes in the product. So, the report should name the movement and show why training is part of the explanation.
For example:
“Sales grew by 12% after the program. The clearest improvement came from teams with high completion, stronger role-play scores, and documented manager coaching. This suggests the training contributed to the result, especially where reinforcement was consistent.”
That wording doesn’t weaken the case. Instead, it makes the case easier to defend. You’re showing that L&D understands the business context, sees the other factors in play, and makes a claim that the data can actually support.
Turn Findings Into Clear Recommendations
Your report should lead stakeholders to a clear conclusion. Don’t end with a list of findings. End with recommendations based on what the results show:
- Low completion among frontline teams with limited desk time → a shorter, mobile-first format
- Good scores but weak behavior change → supervisor check-ins or on-the-job practice
- One repeated onboarding gap → a targeted follow-up module instead of another full course
With a modern platform, these recommendations are easier to act on without slowing down the next rollout. For example, iSpring LMS supports any format change, whether it’s mobile-first programs with offline access, blended learning, on-the-job monitoring, recertification, or individual development plans.
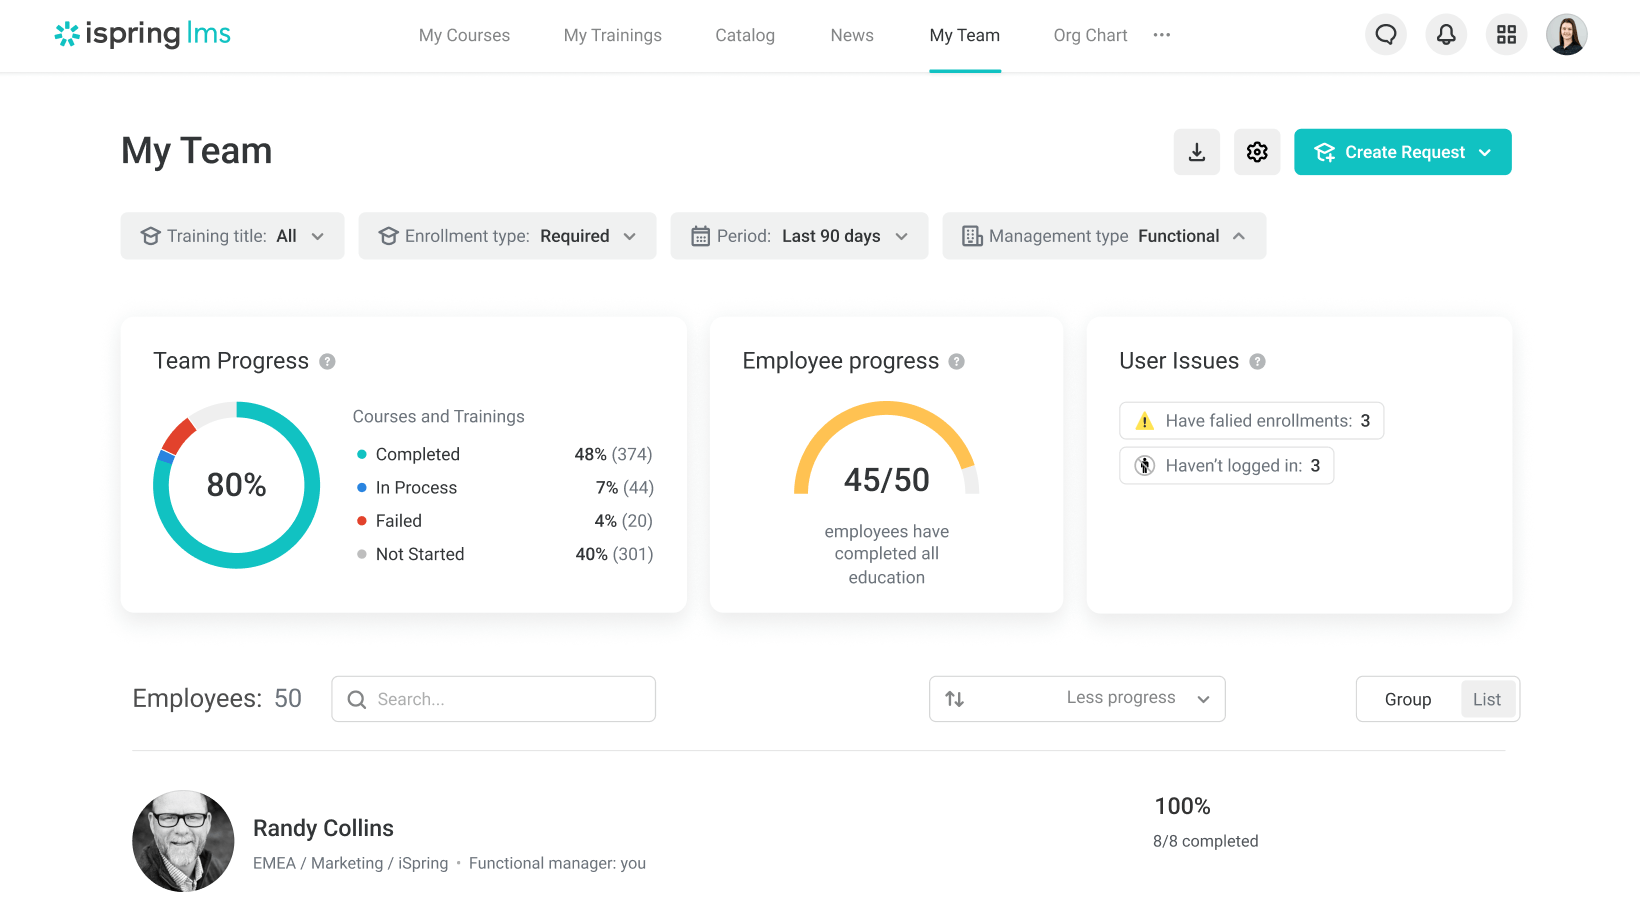

Team leads can also track progress while the follow-up is still running, so the final report doesn’t come as a surprise. In Supervisor Dashboard, they can see the high-level metrics they need in order to understand team progress and spot issues early, without getting buried in data.
Support Better L&D Reporting With The Right LMS
If you want to see how this could work for your training workflow, book a free personalized consultation with an iSpring expert.
During the meeting, you’ll discuss your training project, see the platform in action from both the admin and learner perspectives, explore the capabilities tailored to your case, and decide whether it meets your goals.
Read More:


