







Friday’s July employment report offered an unusually good occasion to revisit something I wrote about almost exactly a year ago: the widespread misunderstanding of revisions to the monthly jobs numbers. On August 7, the Bureau of Labor Statistics reported that nonfarm payroll employment fell by 23,000 jobs in July, while the unemployment rate edged down to 4.1 percent. At the same time, May payroll growth was revised from +129,000 to +63,000 and June from +57,000 to +20,000: a combined downward revision of 103,000 jobs.
Those numbers certainly suggest that the labor market has weakened. The three-month average payroll gain is now only about 20,000. But before turning a disappointing jobs report into either a recession call or another round of accusations that government statisticians are cooking the books, it is worth remembering what these numbers actually are.
They are estimates. The headline payroll number comes from the Current Employment Statistics survey, in which BLS collects payroll information from roughly 119,000 businesses and government agencies representing about 622,000 worksites. That is an enormous sample, covering about one-quarter of American payroll employment. It is nevertheless still a sample. Not every establishment responds immediately, seasonal factors are continually recalculated, businesses are born and disappear, and additional information arrives after the first release. Consequently, revisions are not corrections of “mistakes” in the ordinary sense. They are updates to an estimate as information improves. BLS explicitly notes that the two preceding months are routinely revised as additional survey responses arrive and seasonal factors are recalculated. After two revisions, when nearly all reports have been received, the estimate is considered final.
This distinction matters particularly for July’s negative first print. The reported loss of 23,000 jobs sounds very precise. It is not. BLS estimates that the 90-percent confidence interval surrounding a monthly payroll change is roughly plus or minus 122,000 jobs. Applied mechanically to July, that means a first estimate of −23,000 is consistent with an underlying change somewhere in the neighborhood of −145,000 to +99,000. That does not make the estimate useless. It means that the proper way to read it is as one observation in an evolving stream of evidence rather than as a perfectly measured head count.
That was also the point of my analysis following the extraordinary revisions in the July 2025 report. At the time, May and June 2025 were revised downward by a combined 258,000 jobs. I examined the historical distribution of payroll revisions and found that it was decidedly unlike the neat bell-shaped distribution people often have in mind when they hear that something is “three standard deviations” from normal. Payroll revisions have fat tails: unusually large observations occur considerably more often than a normal distribution would imply.
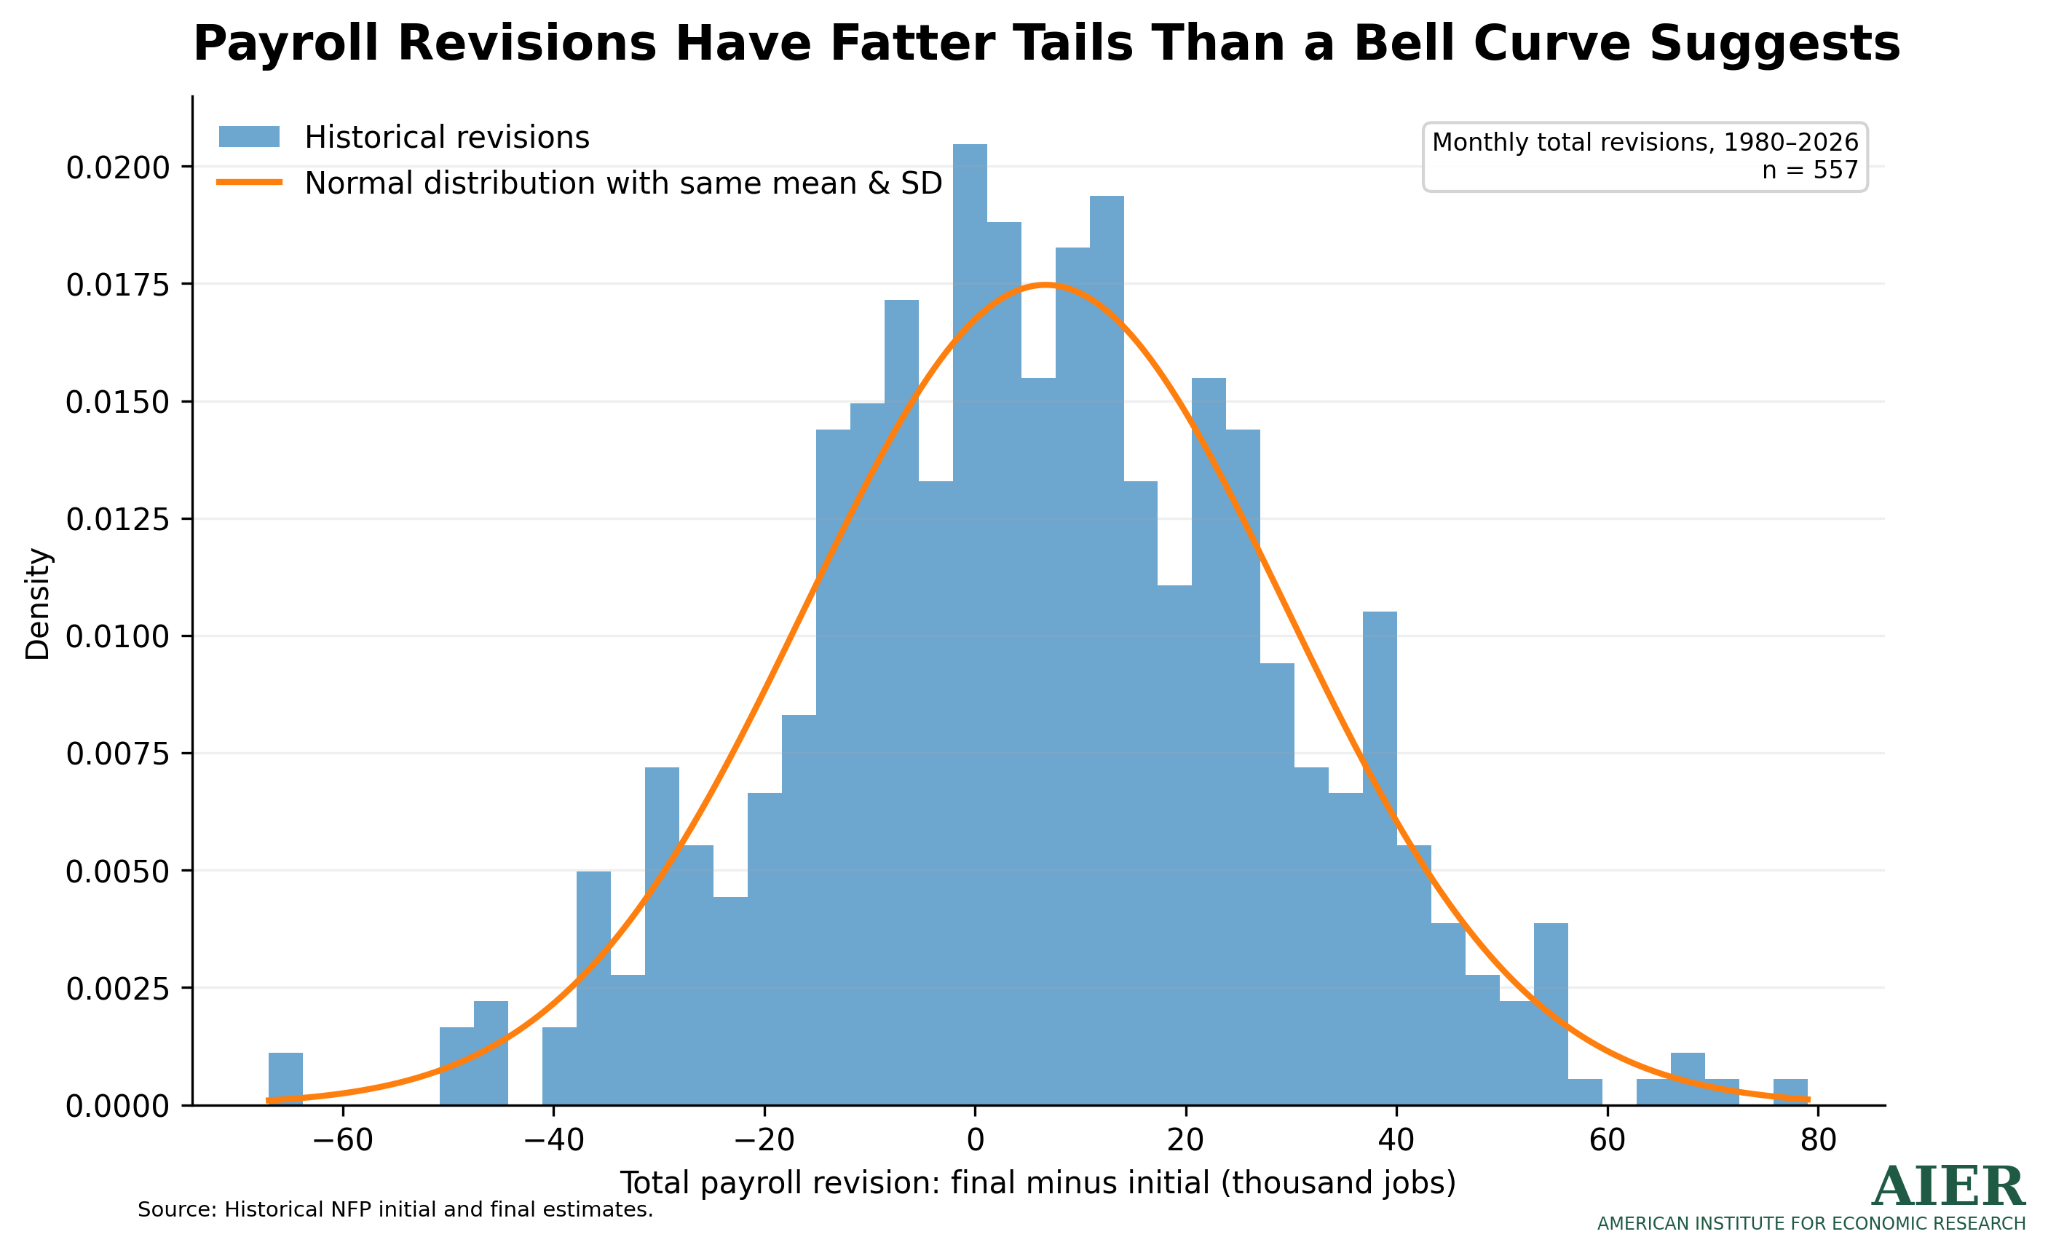
Since then, I have substantially expanded that dataset and asked a more practical question: do revisions themselves tell us something about the business cycle? The answer is yes — but considerably less than headlines sometimes imply.
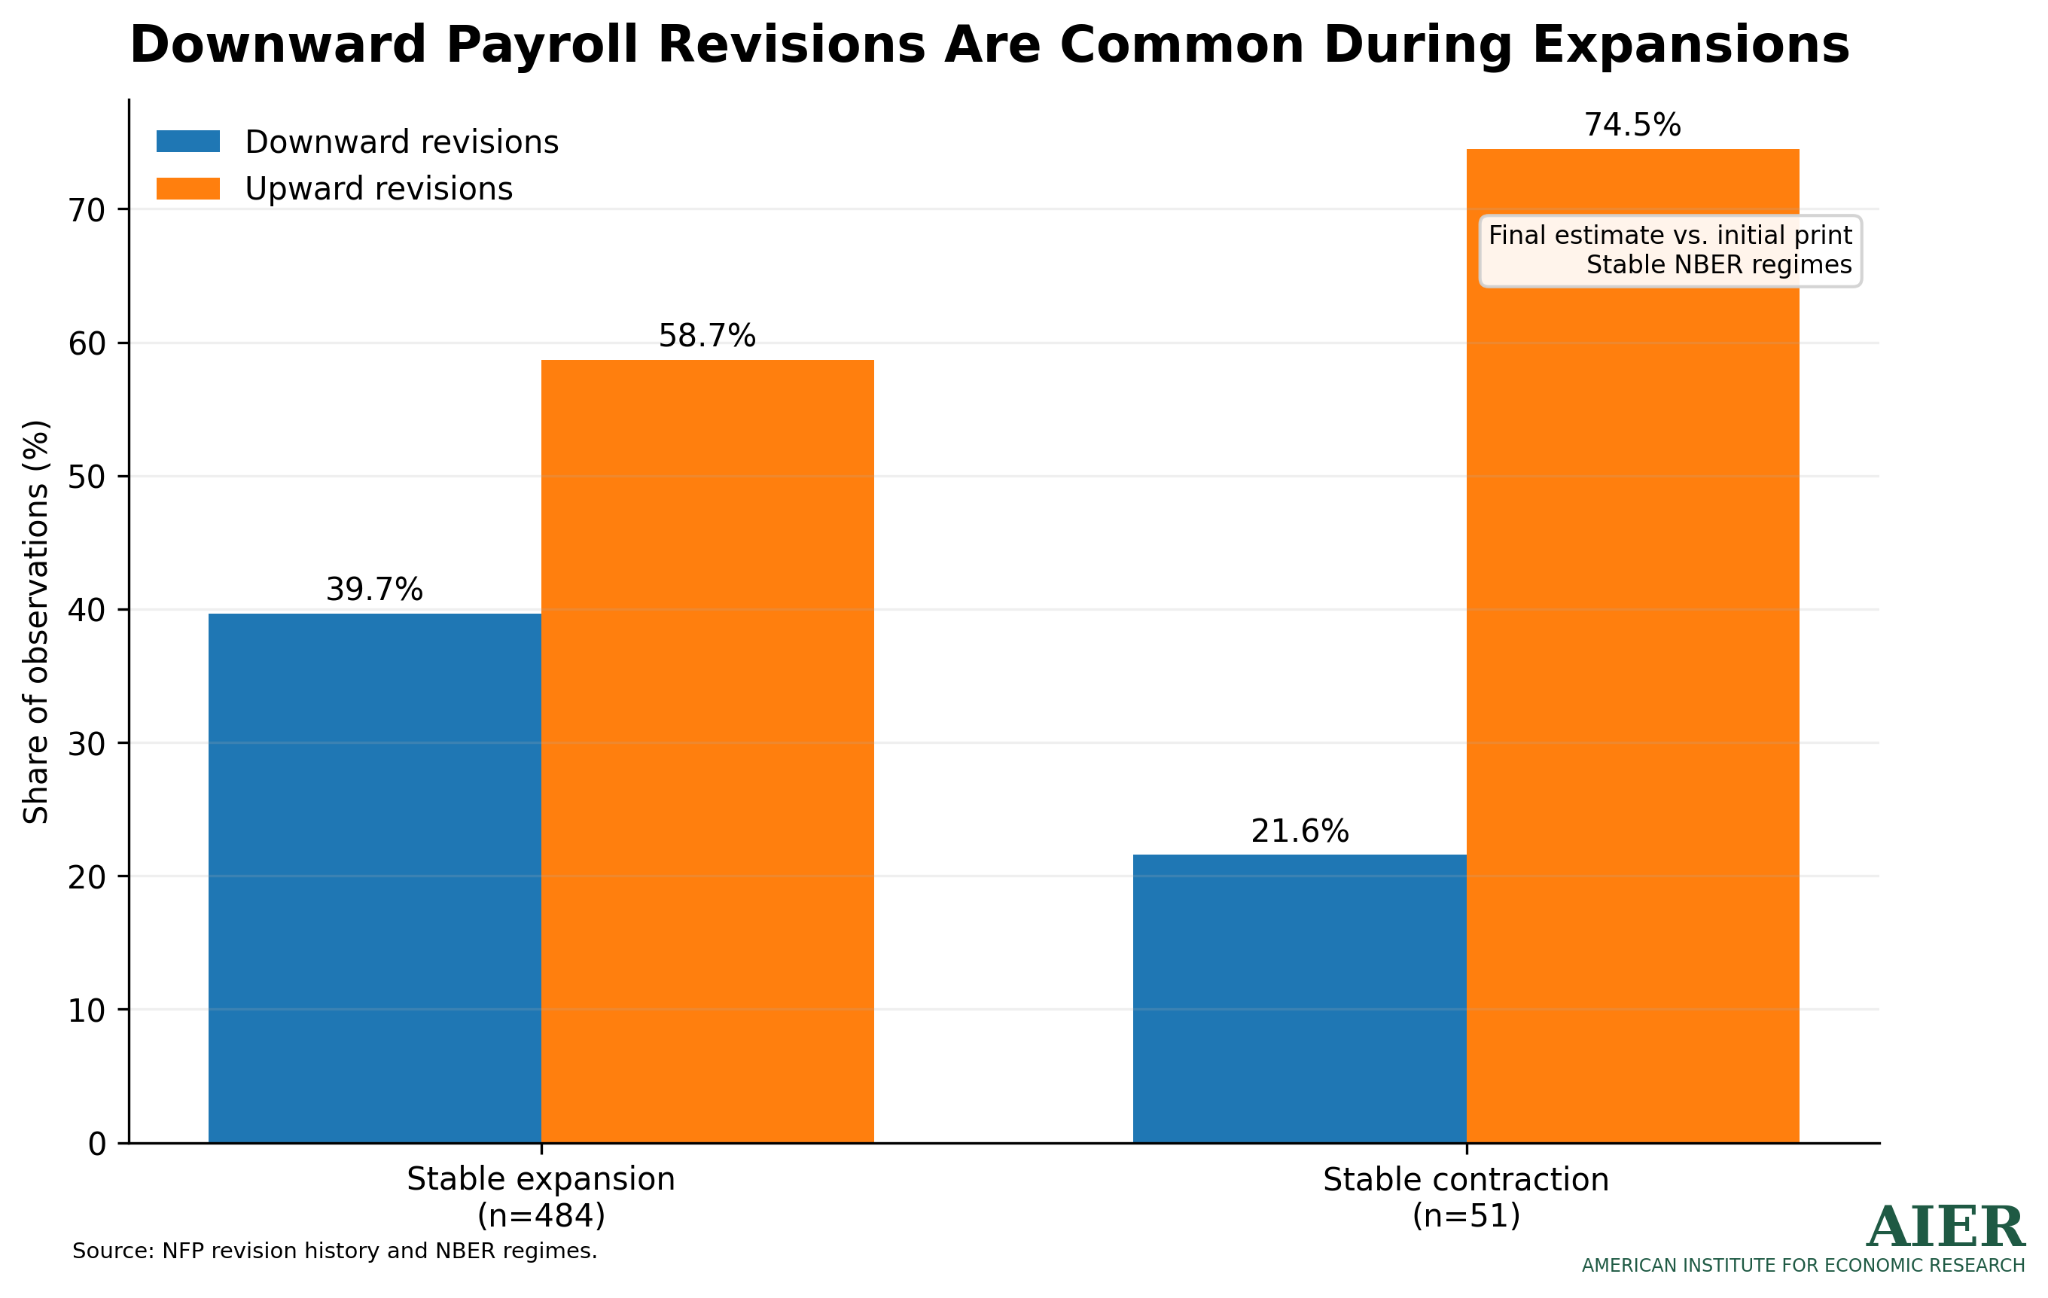
Among 484 observations in my sample where the economy remained in a National Bureau for Economic Research (NBER) expansion from the initial estimate through the final release, nearly 40 percent were revised downward. Downward revisions, in other words, are perfectly ordinary during good economic times. And during stable contractions, upward revisions were actually much more common than downward ones. A single negative revision is correspondingly weak as a recession signal. When an expansion is underway, the historical probability of entering recession within the next 12 months in my sample is about 12.2 percent. After one negative payroll revision, it is 11.0 percent: essentially no warning at all.
Persistence is somewhat more informative. After two consecutive negative revisions, the 12-month recession probability rises to 17.3 percent; after three, 16.7 percent; and after four, 20 percent. The strongest signal appears when repeated downward revisions also acquire meaningful size. Once an ongoing string of negative revisions accumulates to approximately 30,000 to 40,000 jobs, subsequent recession risk rises noticeably. At a cumulative −40,000, the historical 12-month probability reaches roughly 26 percent, more than twice the expansion baseline.

That is interesting, but it is not a recession alarm.
The samples become small quickly, the relationship is not perfectly linear, and extremely large revisions are not automatically more informative than moderately large ones. The sensible conclusion is narrower: one disappointing number tells us little; persistent deterioration across successive estimates deserves considerably more attention.
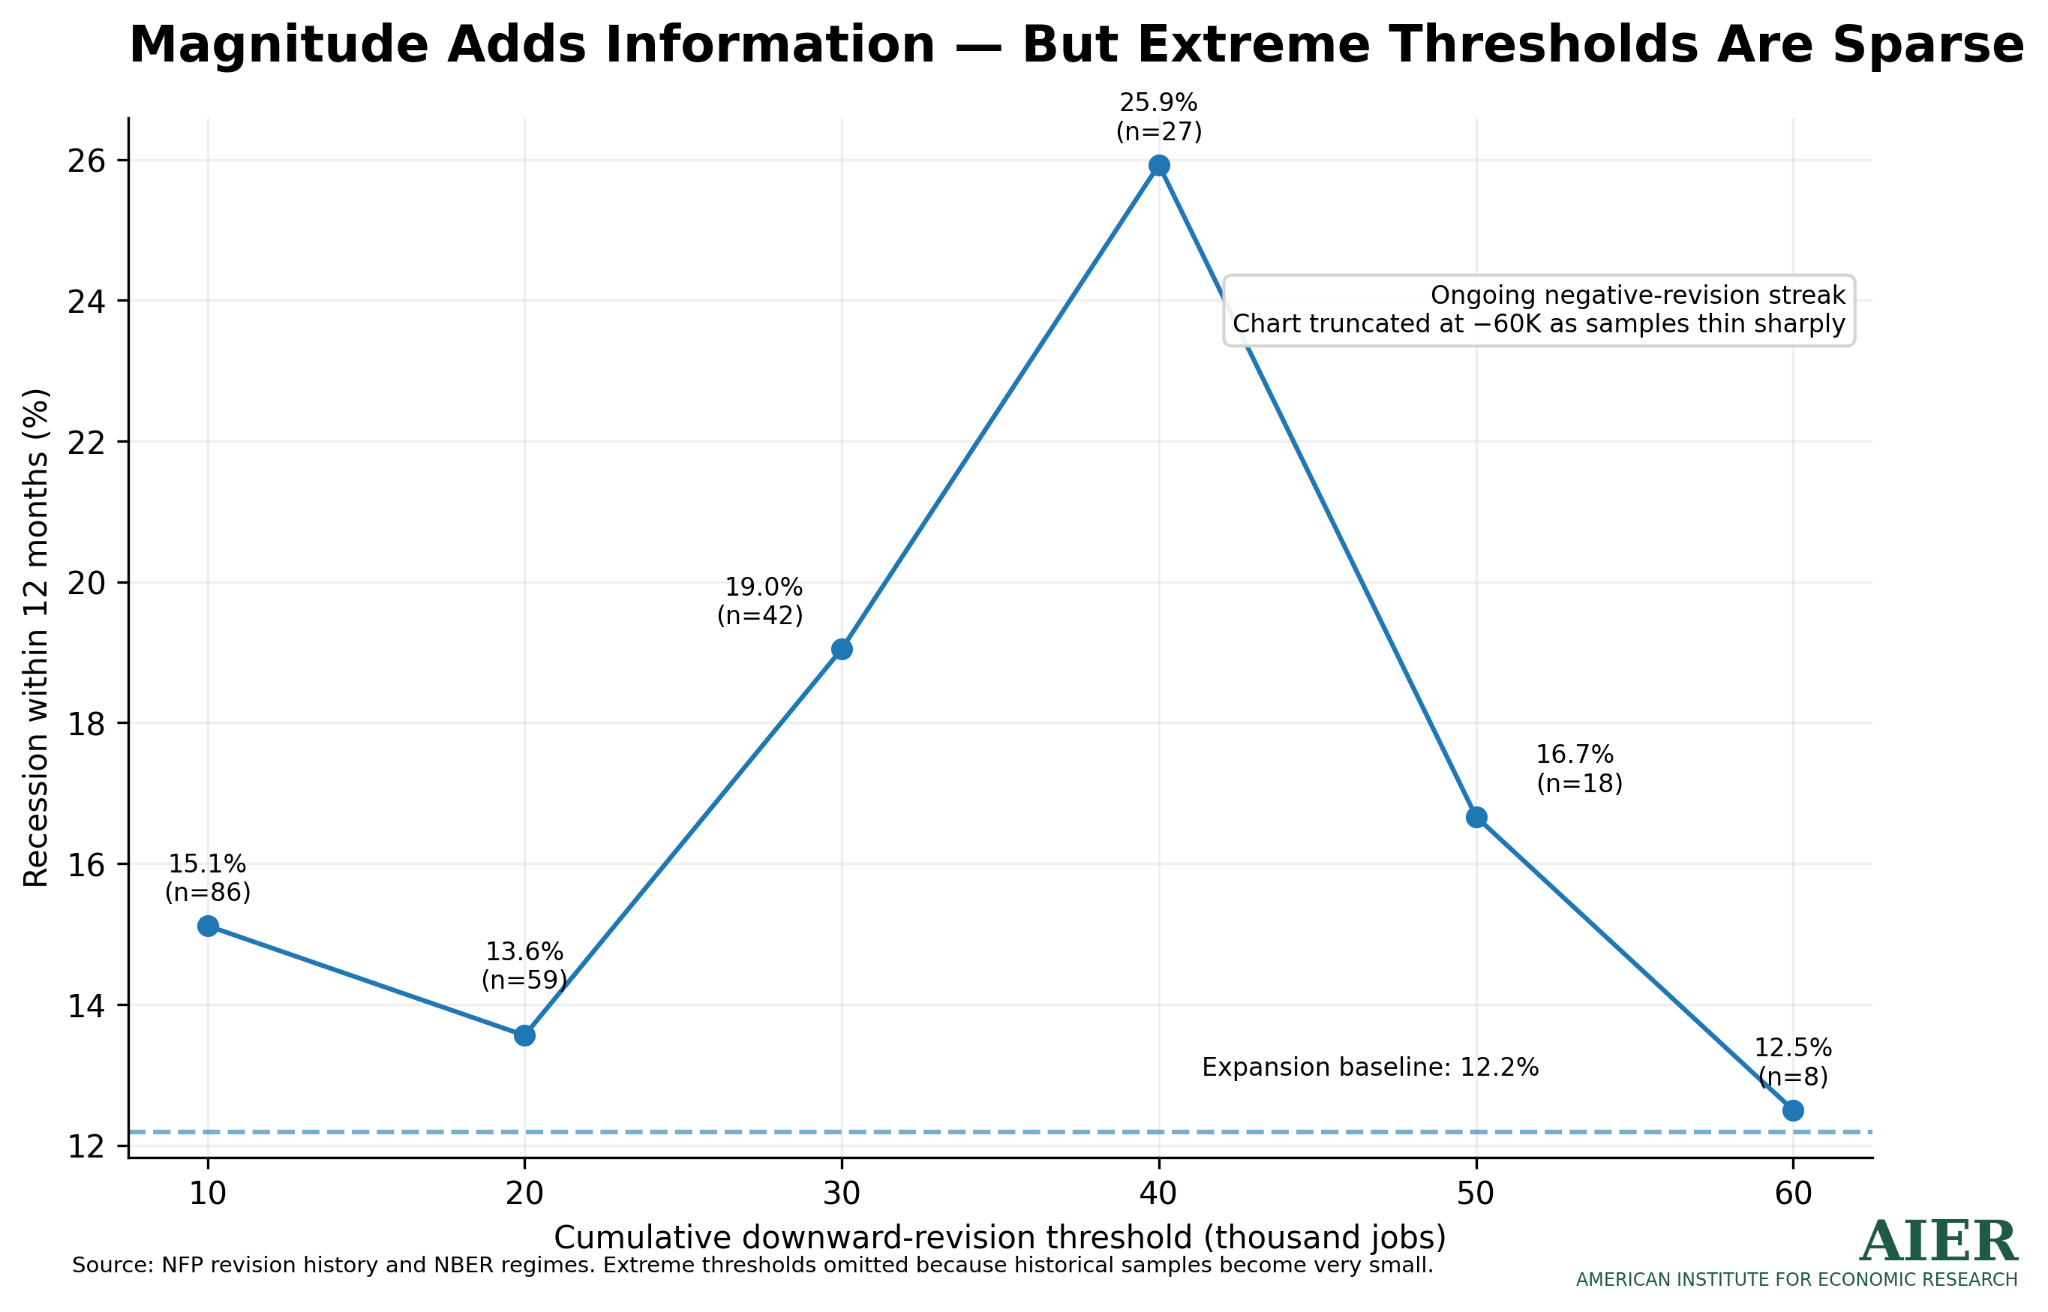
(The above chart should be read as a measure of how the warning signal changes as downward revisions accumulate. During an ordinary expansion, the historical probability of entering recession within the next 12 months is about 12.2 percent. But among the 27 observations in which an ongoing sequence of downward payroll revisions accumulated to at least 40,000 jobs, 25.9 percent were followed by recession within a year: roughly twice the baseline rate. That does not mean a cumulative 40,000 job revision predicts recession, much less causes one; roughly three-quarters of those observations were not followed by recession. Rather, it suggests that once downward revisions become both persistent and sizable, they contain more information about deteriorating economic conditions than a single negative revision does.)
I also subjected the data to some simple forensic tests because accusations that BLS numbers are politically manipulated have become routine. I looked for suspicious rounding and unusual final-digit patterns, calendar effects, election-year behavior, campaign-season anomalies, and partisan differences in revisions. The initial estimates and total revisions showed no suspicious digit patterns. Average revisions did not vary meaningfully by calendar month. Presidential election years showed no statistically meaningful revision bias, and during August through October of presidential-election years — the period when political incentives ought to be greatest if manipulation were occurring — average revisions were virtually identical to those in other months.
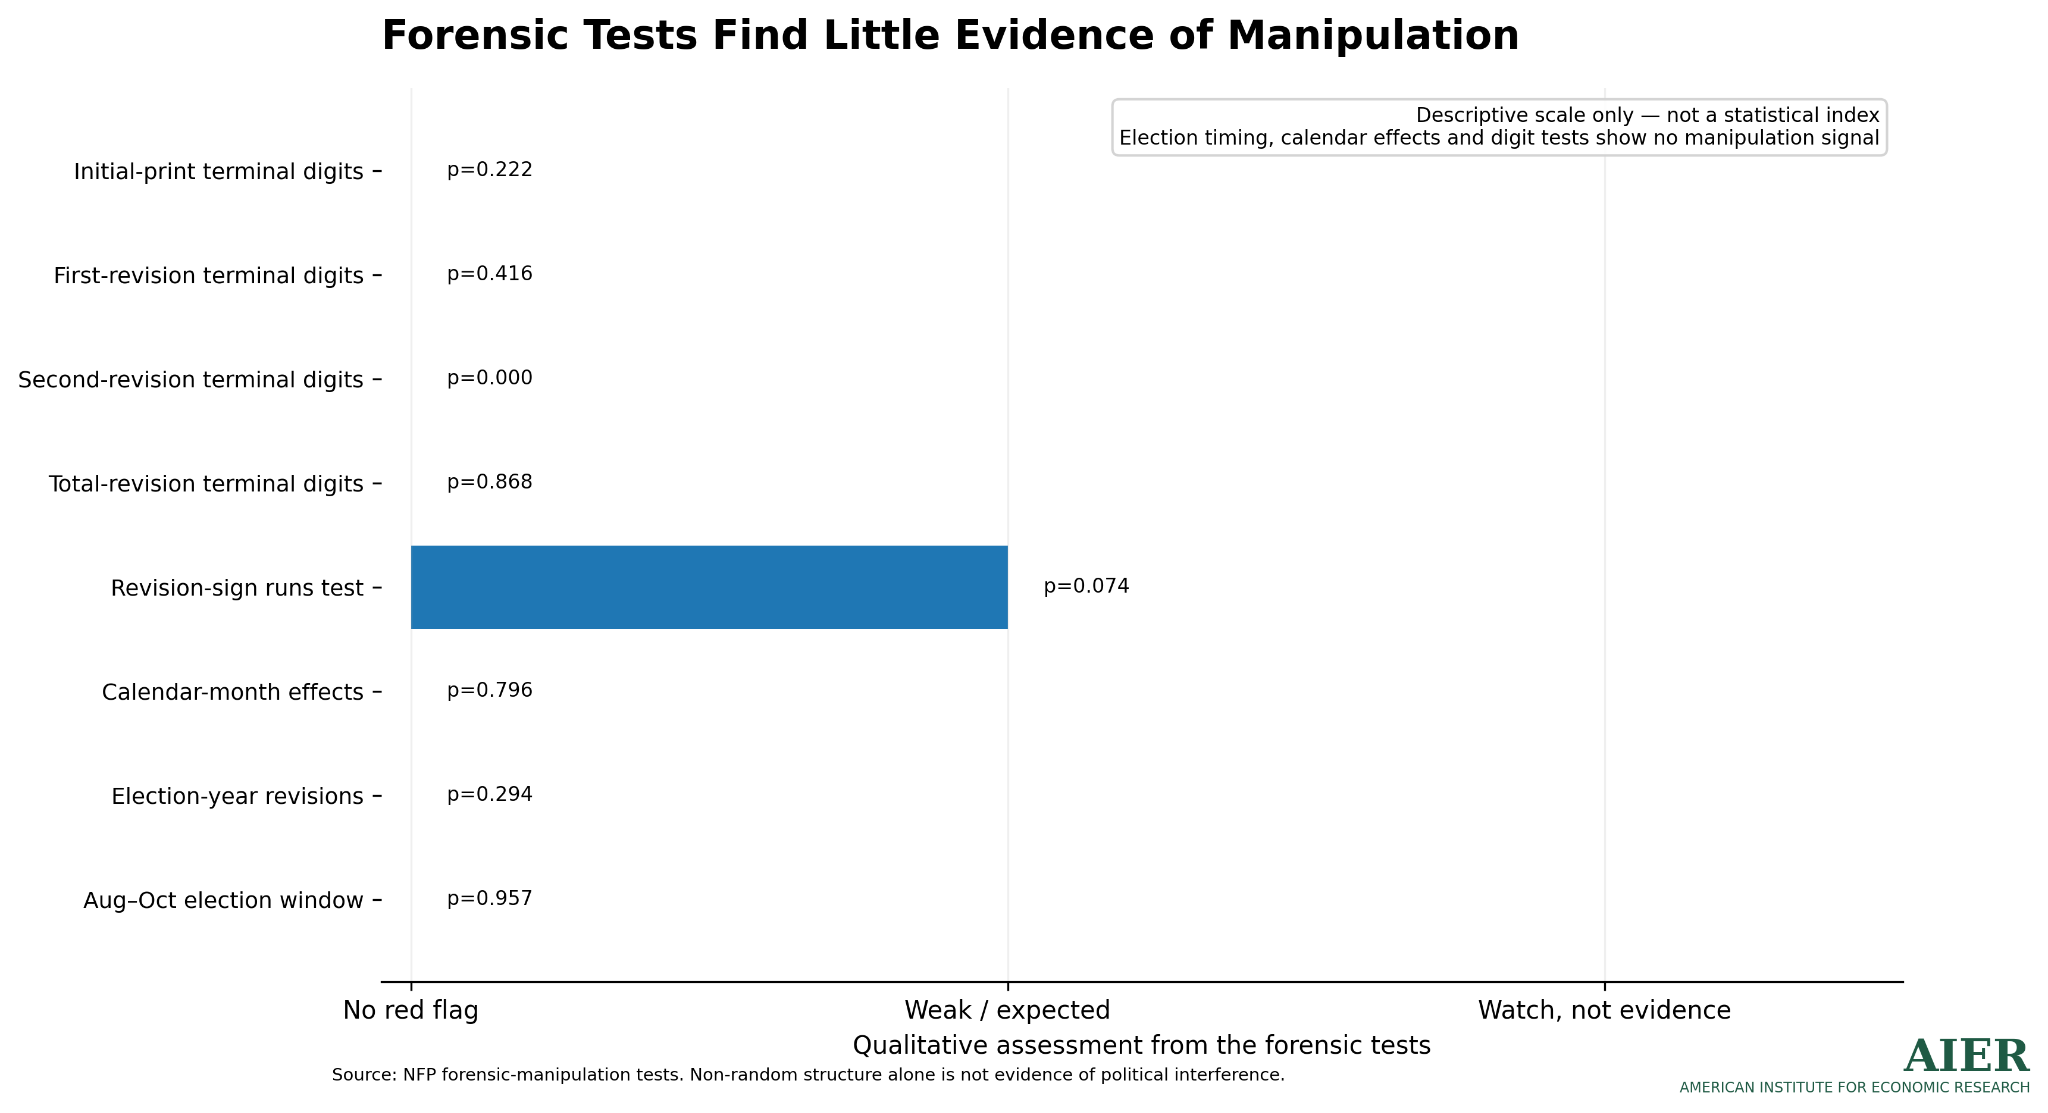
(The forensic tests look for statistical fingerprints that might suggest systematic distortion. Terminal-digit tests find no suspicious heaping in initial prints, first revisions, or total revisions; the unusual pattern in second revisions is consistent with later adjustments clustering near zero. A runs test finds mild persistence in the direction of revisions, but nothing inconsistent with changing economic conditions, while calendar-month tests find no recurring seasonal pattern. Most importantly, revisions in presidential election years and during the politically sensitive August–October campaign window are statistically indistinguishable from other periods. None of these tests can rule out manipulation categorically, but together they provide no statistical evidence of systematic political interference.)
There are patterns in the data. Economic statistics are not random numbers generated by a roulette wheel. Revisions cluster, business conditions change, reporting arrives unevenly, and turning points are particularly difficult to measure. Non-randomness is not evidence of fraud.
July’s −23,000 nonfarm payrolls number deserves attention, particularly alongside the weaker May and June estimates. But the lesson from nearly half a century of revisions is not that the latest number should be ignored. It is that we should resist giving any single first estimate more authority than it demonstrably possesses. The monthly jobs report is best understood not as a final measurement of the economy, but as a successive attempt to see something enormous, complicated, and constantly changing with necessarily incomplete information.


