

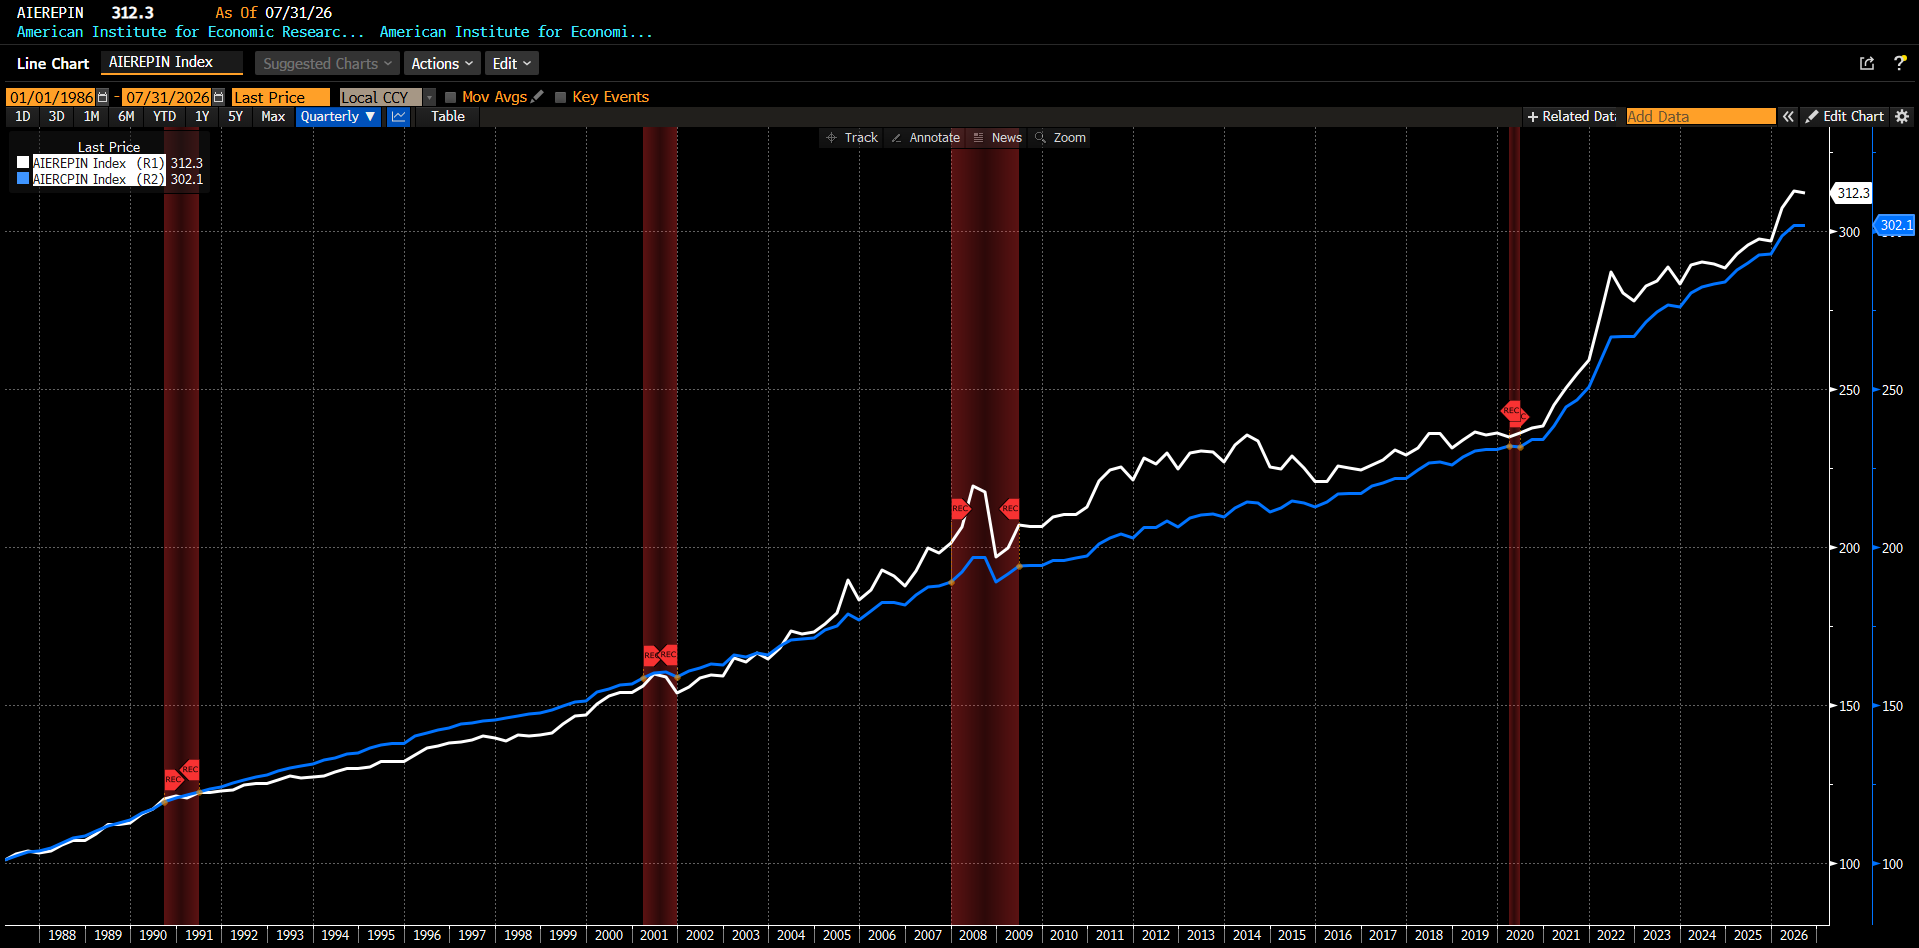
The AIER Everyday Price Index (EPI) declined 0.15 percent in July 2026, marking its second consecutive monthly decrease. The back-to-back declines are notable: the last time the EPI fell for two or more consecutive months was in the fall of 2024. Despite the latest easing, everyday prices remain substantially higher than a year ago, with the index up 5.47 percent on a year-over-year basis. Price movements were also broadly tilted upward beneath the headline decline: 18 EPI categories increased in July, five declined, and one was unchanged.
The largest monthly increases occurred in recreational reading materials, purchase, subscription, and rental of video, and intracity transportation. Those gains were more than offset by declines concentrated in several categories, led by admissions to movies, theaters, and concerts, prescription drugs, and motor fuel. Thus, July’s modest overall decline reflected relatively large price decreases in a handful of components rather than broadly falling prices: an important distinction given that three-quarters of the EPI’s individual categories actually became more expensive during the month.
AIER Everyday Price Index vs. US Consumer Price Index (NSA, 1987 = 100)
Additionally, on August 12, 2026, the US Bureau of Labor Statistics (BLS) released the July 2026 Consumer Price Index (CPI) data.
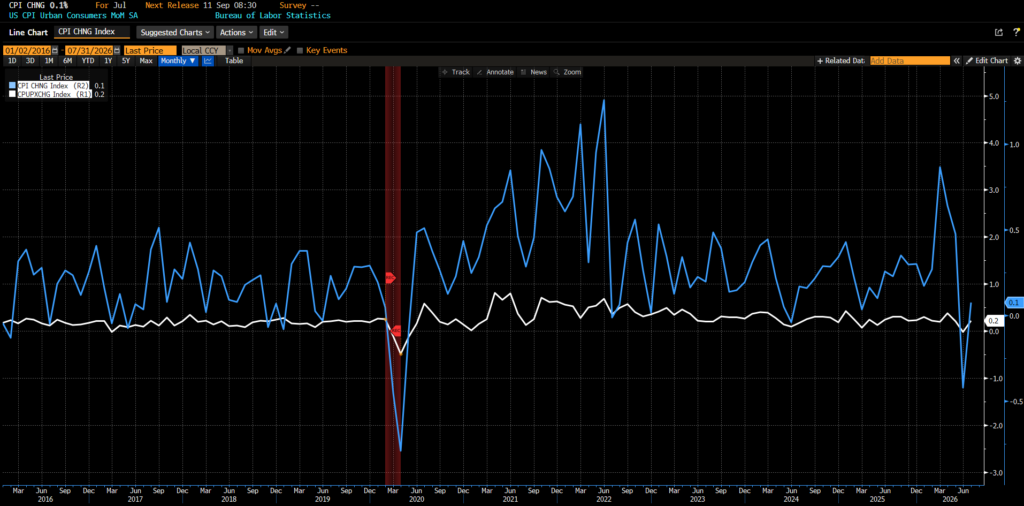
Headline CPI rose 0.1 percent on a seasonally adjusted basis in July after falling 0.4 percent in June. Core CPI, which excludes food and energy, lifted 0.2 percent after remaining unchanged in June.
July 2026 US CPI headline and core month-over-month (2016 – present)
Consumer prices in July reflected falling energy costs alongside modest increases in shelter and food. Energy declined 1.5 percent after plunging 5.7 percent in June, led by a 2.9 percent drop in gasoline prices. Natural gas rose 0.7 percent and electricity edged up 0.1 percent. Shelter increased just 0.1 percent for a second consecutive month but accounted for roughly two-thirds of the overall CPI increase. Rent and owners’ equivalent rent each rose 0.3 percent, while lodging away from home fell 2.8 percent.
Food prices rose just 0.1 percent, while food at home declined 0.1 percent. Meats, poultry, fish, and eggs fell 0.7 percent, fruits and vegetables and dairy each slipped 0.1 percent, while nonalcoholic beverages rose 0.9 percent. Food away from home increased 0.3 percent, including a 0.4 percent rise in limited-service meals.
Core CPI rose 0.2 percent after being unchanged in June. Medical care increased 0.4 percent, airline fares climbed 2.2 percent, communication rose 0.6 percent, and used cars and trucks increased 0.4 percent. Prescription drugs fell 0.8 percent and motor vehicle insurance declined another 0.3 percent. Overall, July showed somewhat firmer core inflation but continued softness in energy and grocery prices, with shelter inflation remaining unusually subdued.
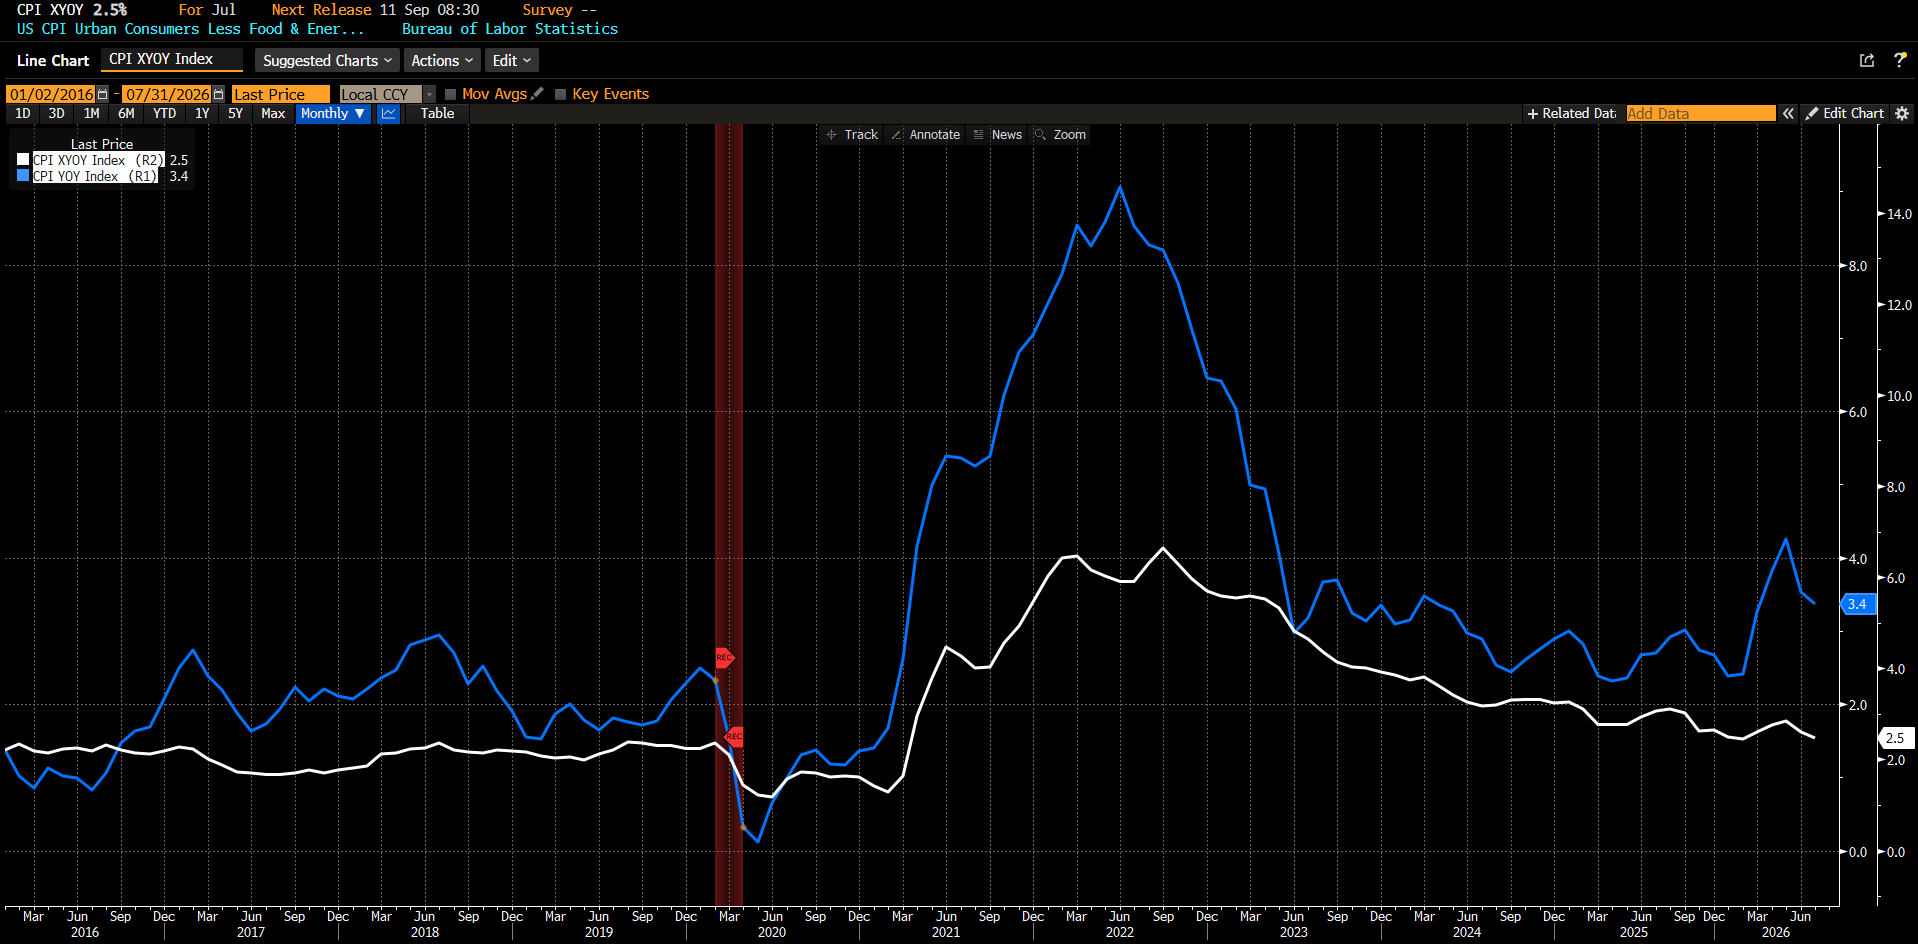
June 2026 US CPI headline and core year-over-year (2016 – present)
Grocery inflation held at 2.7 percent over the twelve months through July, but the underlying categories varied considerably. Fruits and vegetables climbed 5.1 percent and nonalcoholic beverages rose 4.1 percent, while cereals and bakery products increased 2.7 percent and meats, poultry, fish, and eggs rose 1.9 percent. Dairy prices moved against the broader trend, falling 0.5 percent. Restaurant prices continued to outpace groceries, rising 3.4 percent overall, with similar increases at both full- and limited-service establishments.
The much larger annual increases remained concentrated in energy. Energy prices stood 14.7 percent above July 2025 levels, primarily reflecting a 24.6 percent rise in gasoline. Electricity and natural gas posted considerably smaller but still meaningful increases of 4.2 percent and 4.3 percent, respectively. Those figures also highlight the distinction between the recent direction of prices and their level relative to a year ago: energy has fallen sharply over the past two months but remains substantially more expensive on a twelve-month basis.
Elsewhere, inflation was comparatively restrained. Core CPI increased 2.5 percent over the year, with shelter up 3.2 percent, recreation 2.6 percent, household furnishings and operations 2.2 percent, and medical care 1.7 percent. Airline fares remained the conspicuous exception, surging 25.5 percent from a year earlier and standing far outside the range of most other major core categories.
July’s inflation data strengthened the case for the Federal Reserve to remain on hold in September without eliminating the possibility of another rate increase. Headline CPI rose just 0.1 percent for the month and slowed to 3.4 percent year over year, while core CPI increased 0.2 percent and eased to 2.5 percent annually, matching its slowest pace since early 2021. Shorter-term measures were similarly encouraging: annualized core inflation ran at 1.6 percent over three months and 2.4 percent over six months. Energy again provided substantial relief, with gasoline falling 2.9 percent and energy subtracting roughly 0.11 percentage point from headline CPI. Grocery prices declined 0.1 percent, while shelter rose only 0.1 percent. Some earlier price pressures also appear to be unwinding: hotel rates fell sharply, vehicle insurance declined for the sixth time in seven months, prescription drugs dropped 0.8 percent, and several food and metal-sensitive categories softened. Core goods, however, rose 0.2 percent, with used vehicles up 0.4 percent and notable strength in computers and other electronics amid the continuing memory-chip shortage.
The details were somewhat less uniformly benign than the headline figures suggest. Core services rose 0.2 percent after being flat in June, rents accelerated to roughly 0.3 percent, and airline fares jumped 2.2 percent. Inflation breadth also increased: about 53 percent of core CPI components registered annualized inflation above 2 percent, compared with a 42 percent average during the second quarter, while the share running above 4 percent climbed from 31 percent to 41 percent. Even so, several discretionary service categories remained weak, and the fading effects of earlier energy, food, metals, and tourism-related shocks point toward continued disinflation. Estimates based on the CPI and related producer-price inputs suggest July core PCE could rise roughly 0.2 percent, although that measure has generally been running somewhat hotter than core CPI.
Markets interpreted the report as reducing the urgency for additional monetary tightening, particularly following July’s weak employment report. The Fed nevertheless faces competing signals: underlying inflation is approaching multi-year lows and hiring has weakened, but inflation remains above target, price increases broadened somewhat in July, and renewed geopolitical pressure on oil represents an important upside risk. With another CPI report and another employment report due before the September 15 – 16 FOMC meeting, the July data favor patience rather than a decisive policy turn: they make an immediate hike harder to justify, but leave the decision sensitive to incoming inflation, labor market, and energy price developments.
